


THE MACRO SETUP OVERVIEW:
FINANCIAL SUPERBOWL WEEK
This week’s The Macro Setup, featuring Dan Nathan and Guy Adami, focused on the upcoming slate of US tech earnings, what the Chinese stock selloff means for traders, and how markets are shaping up ahead of the July FOMC meeting. With all of the news, events, and activity, it’s shaping up to be a bit like the week of the Superbowl – but with a financial markets flavor.
Companies like Apple are trading at their all-time high valuation, and it’s clear that the ‘big names’ are carrying the headline indexes. While the Nasdaq 100 and S&P 500 have traded to all-time highs, equal-weighted measures of the various stock markets suggest that participation in the US equities rally is thinning out. This makes for a tricky environment that could produce meaningful downswings if FAANG (or FMAGA (Facebook, Microsoft, Apple, Google, and Amazon), as Dan Nathan says) decline around earnings.
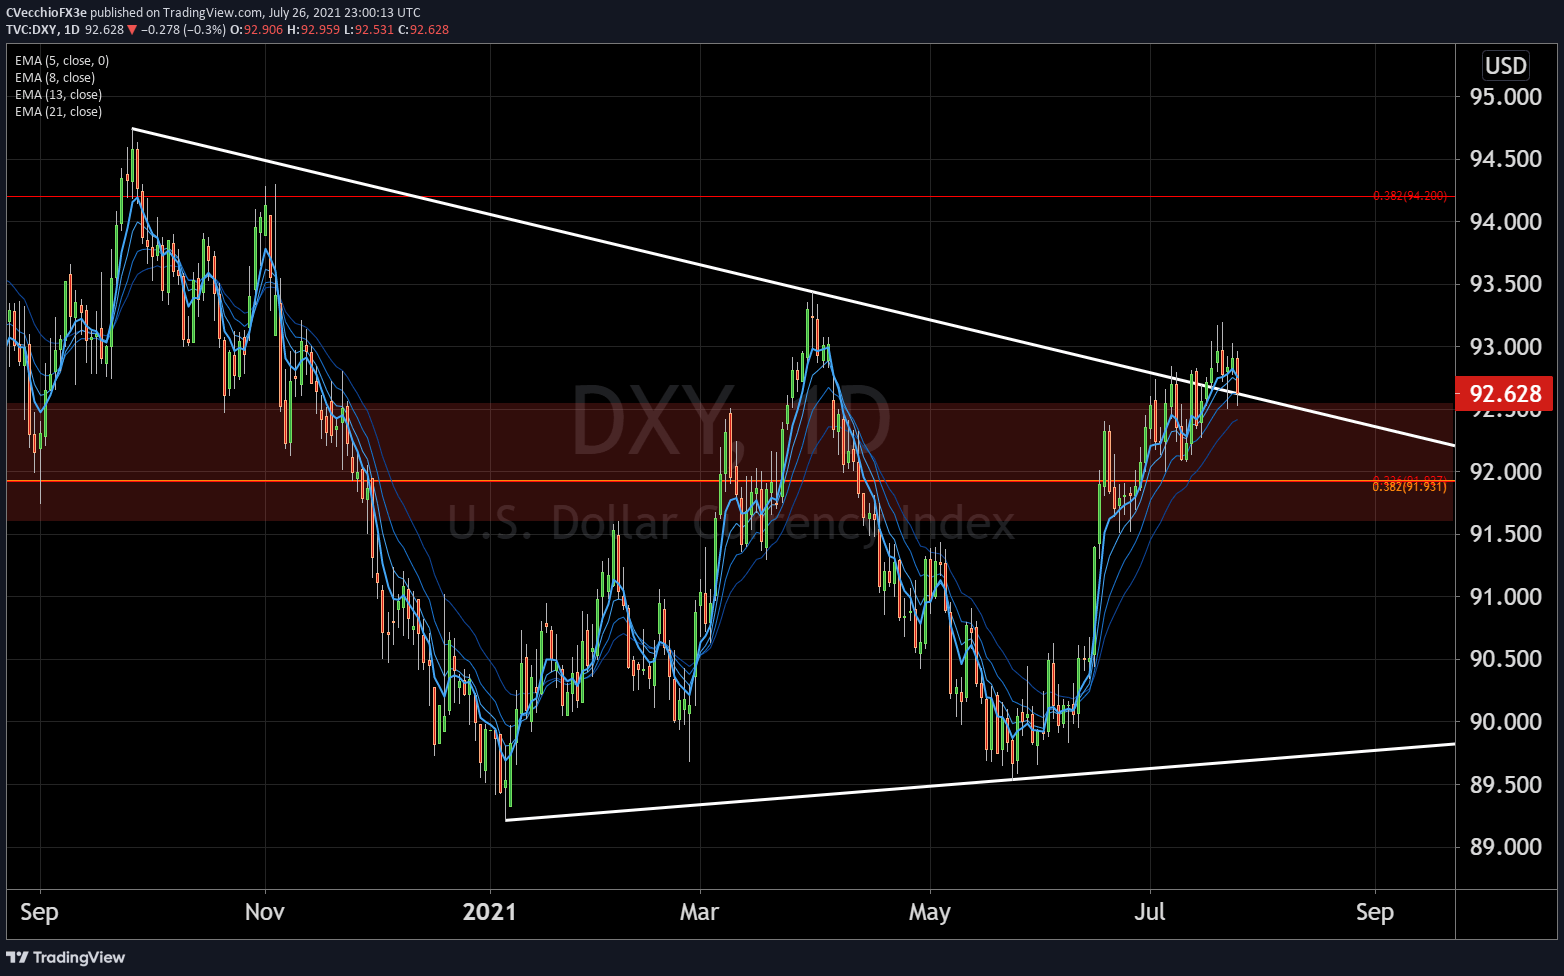
Elsewhere, ahead of the July FOMC meeting, it’s difficult to have faith in the US Dollar’s rally. An environment defined by lower US Treasury yields, record low US real yields (nominal Treasury yields less inflation), and declining Fed rate hike odds has historically proved difficult for the greenback.
The market may experience some volatility around the Fed meeting Wednesday, but all attention is squarely focused on what may transpire at the August Jackson Hole gathering. After all, Fed Chair Jerome Powell just testified in front of Congress two weeks ago; not much has changed since then.
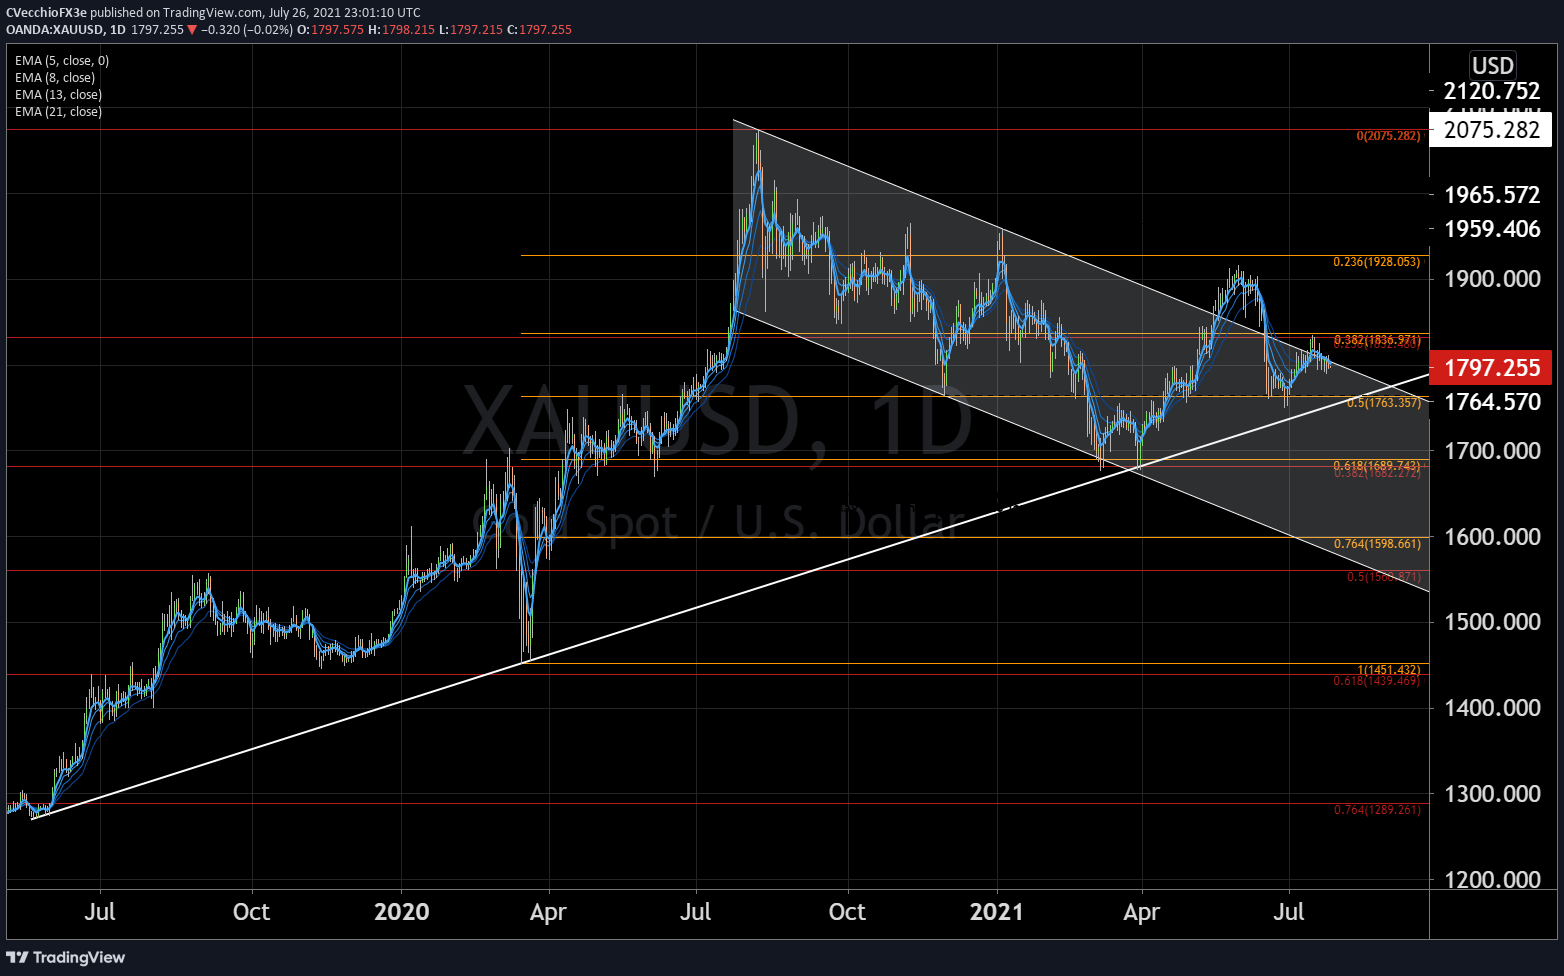
Finally, it’s noteworthy that in what should theoretically be an incredibly bullish environment for gold prices, gold continues to just “meander around,” as Guy Adami noted. The fact of the matter is that gold and bitcoin have traded in somewhat of an inverse relationship, and that gold prices can’t seem to rally despite all of the obvious tailwinds is a major red flag for bullion.
*For commentary from Dan Nathan, Guy Adami, and myself on the US Dollar (via the DXY Index), the US S&P 500, gold prices, among others, please watch the video embedded at the top of this article.
CHARTS OF THE WEEK
GOLD PRICE TECHNICAL ANALYSIS: DAILY CHART (JULY 2020 TO JULY 2021) (CHART 1)
DXY INDEX PRICE TECHNICAL ANALYSIS: DAILY CHART (JULY 2020 TO JULY 2021) (CHART 2)
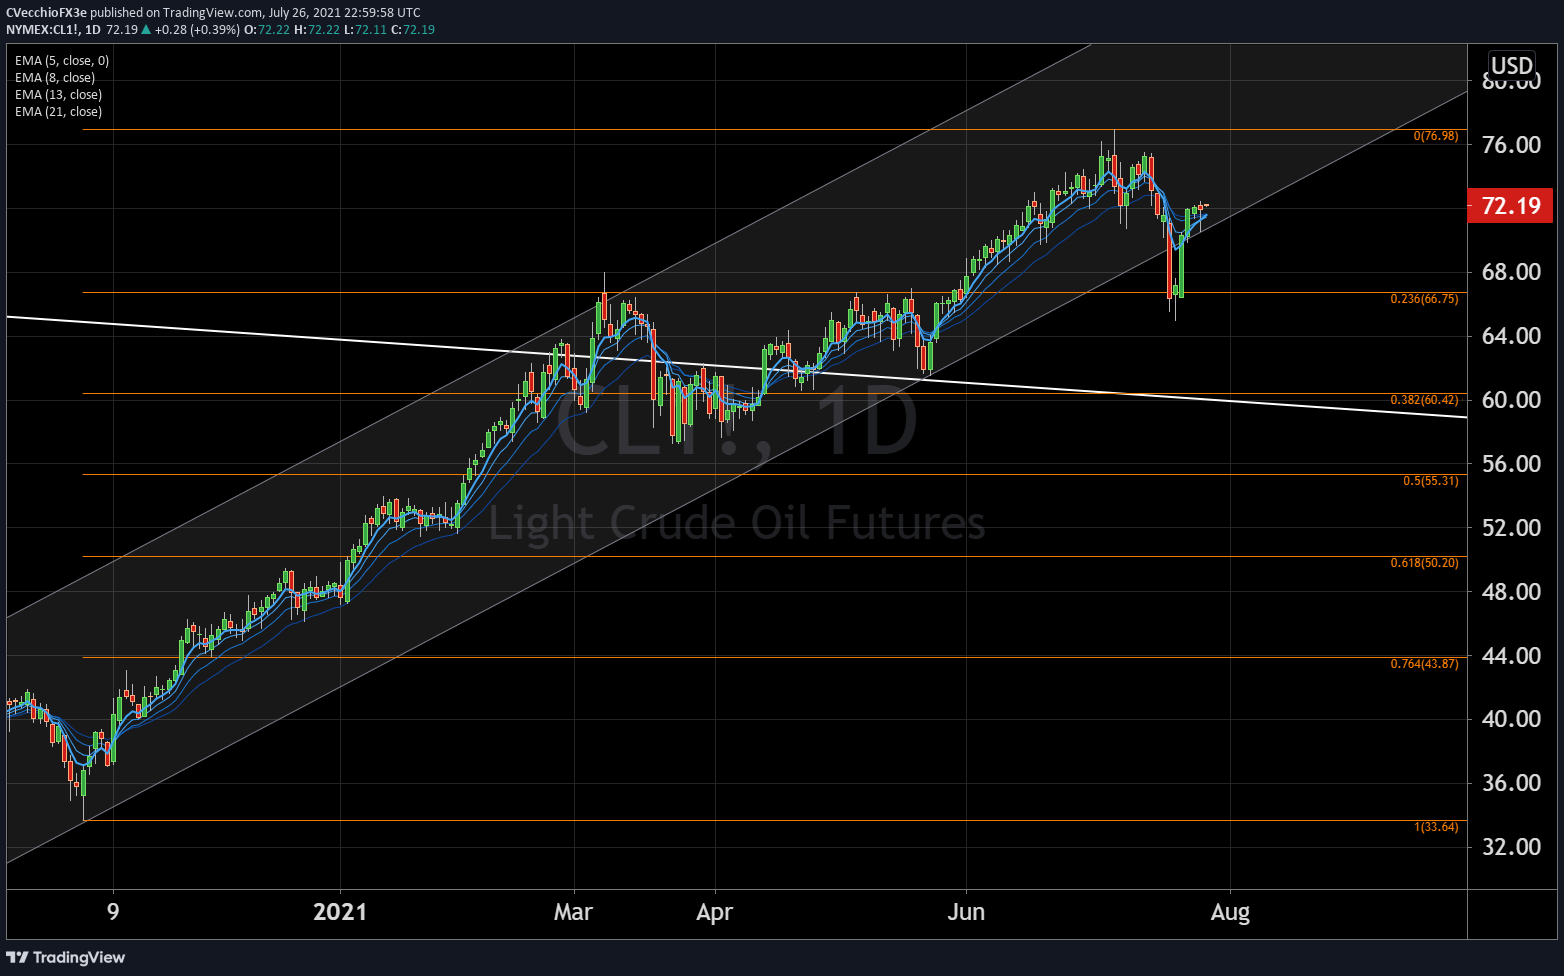
CRUDE OILPRICE TECHNICAL ANALYSIS: DAILY CHART (OCTOBER 2020 TO JULY 2021) (CHART 3)

--- Written by Christopher Vecchio, CFA, Senior Currency Strategist


