Ichimoku Technical Analysis Focus:
- GBP trades to the highest level against USD since June 23, 2016, more gains could follow
- Haven currencies continue to weaken with CHF trading to a 3-year low against EUR
- AUD has joined the Commodity FX party as RBA Minutes shift hawkish and trade war fears recede
Currencies are often categorized to help traders get a handle on what themes are permeating the market. You have the G4 (EUR, JPY, GBP, & USD) that trade on broad macro developments as well as monetary policy. From there, you have specific characteristics that tend to drive currencies due to terms of trade (value of exports minus value of imports) that are key for commodity currencies like the Australian Dollar, New Zealand Dollar, Norwegian Krone, and the recently red-hot Canadian Dollar.
Two other categories, though there are more are haven currencies that are bid when times are bad like the Swiss Franc and Japanese Yen and the Emerging Market or High Beta currencies that tend to see upside when global trade is at an upswing or that are sold when trade war threats are aired.
Currently, applying Ichimoku cloud to the charts can help you see that the category with a clear theme right now is haven currencies and their accelerating weakness, which we’ll break down in a moment.
Additionally, the Ichimoku Charts that matter this week will focus on the following currencies:
- JPY & Swissy weakness that aligns with the bid in commodities and equities
- Resumption of British pound strength that continues to push toward resistance
- AUD strength catching up to the rest of the commodity bloc complex
Want a full (& FREE) guide to walk you through Ichimoku? I created one here (click Advanced Guides)
Ichimoku Analysis Applied to Swiss Franc (CHF)- Bearish View in Play
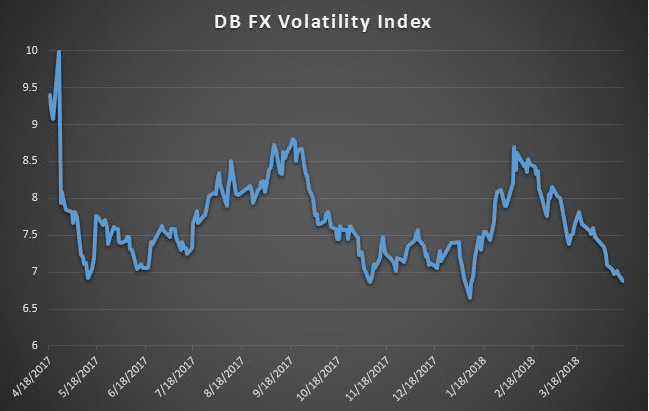
First in focus is the weakening Swiss Franc that has been removed from the normalization of monetary policy discussion. The currency does seem to have upside due to the heightened geopolitical risk, but given the broader bull market in equities and now commodities the environment seems to favor further weakness of the Swissy. A key driver of CHF (and JPY for that matter) strength is FX volatility. Looking to the Deutsche Bank Currency Volatility Index trading below 2017 lows and near 2018 lows, we appear to be a long way a ways from a favorable CHF buying environment.
G10FX Volatility Continues To Be Depressed
Data source: Deutsche Bank, Bloomberg
The CHF recently moved into the Ichimoku cloud after trading sideways for nearly threemonths. In addition to the cloud, Ichimoku has also come into a long-term trendline drawn from lower-highs that seem to favor the broader bearish view of US Dollar until the price trades above the cloud and the trendline.
EUR/CHF Is Reproaching the January 2015 Level of 1.2000
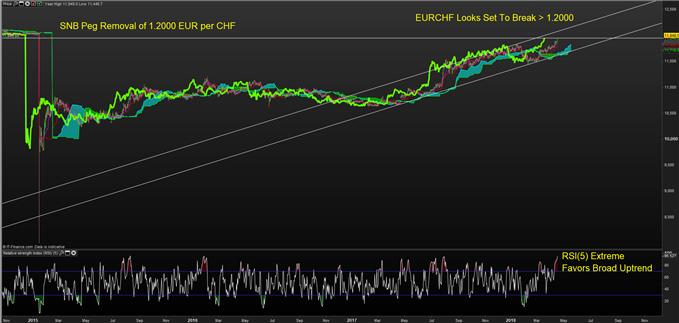
Chart Source:Pro Real Time, IG UK Price Feed. Created by Tyler Yell, CMT
Looking above, all signs are clear for Bullish continuation as the price is above the daily Ichimoku Cloud with the lagging line above prior price and the cloud. The price of EUR/CHF continues to trade above the 9- and 26-period midpoint and only a close below the 9-period midpoint (Tenkan-Sen) would argue that the trend is pausing.
EUR/GBP Resuming Its Decline After Multi-Month Consolidation
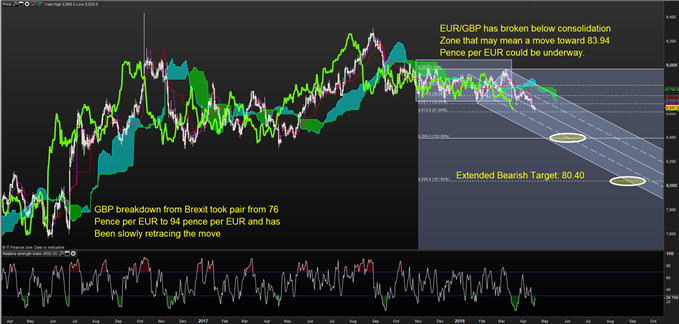
Chart Source:Pro Real Time, IG UK Price Feed. Created by Tyler Yell, CMT
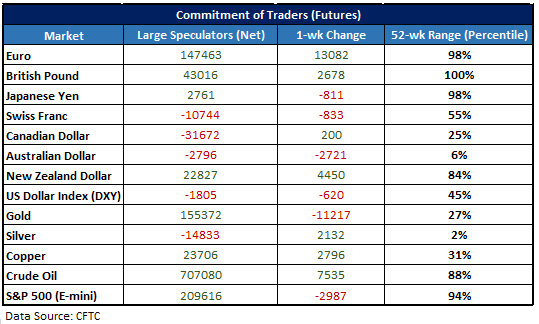
The case for a strengthening British Pound has been strong and investors have taken notice. A look at the CFTC commitment of traders report, and the Ichimoku chart shows that Sterling is in favor with investors.
Article source: CoT Weekly Sentiment Update – EUR/USD, USD/JPY, Crude Oil & More
While some may see the extreme bullish positioning as a risk for Sterling longs, and they’d be right, it’s worth noting that this is displayed on a 52-week range. That range does not mean that 100% is the most it can be in terms of net-long positions, but that institutions have not been this bullish on sterling in the last year when measured by futures contract exposure.
From an Ichimoku perspective, this set-up is text-book bearish continuation for EUR/GBP. In short, the price is below the daily cloud and the lagging line is below both while bullish institutional positioning is simply wind in the sails and should keep sellers at bay.
Adding to positive British Pound developments is increasing Brexit clarity and lack of labor slack that favors a repricing of BoE rate hike expectations for the May 10 meeting (a hike is priced in here) and the November meeting (currently not priced into the market.) Combine that picture with decaying EU data and possible ECB jawboning the EUR lower and you could see this trend extend.
I like this trade and wrote an analyst pick that you can access here: Tactically Bearish EUR/GBP on Improving UK Economy, Hawkish BoE
Ichimoku Analysis Applied to Australian Dollar- Tactically Bullish View in Play
To be tactically bullish is to favor specific currencies that are to be sold against the Australian Dollar. Currently, that dishonor goes to haven currencies (CHF, JPY), and the US Dollar. A recession of negative news flow on trade and an aggressive commodity market has allowed AUD/USD to trade above its 12-month average at 0.7743. A move above the March 9 high at 0.7854 would argue that the Bull trend is continuing as the price faces key Ichimoku resistance of the daily cloud.
Australian Dollar Attempts to Join Relatively Strong Commodity FX
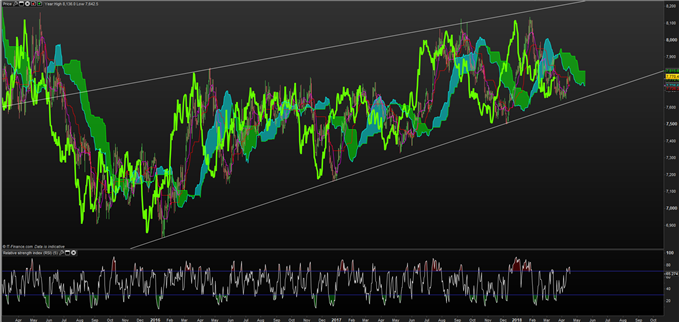
Chart Source: Pro Real Time with IG UK Price Feed. Created by Tyler Yell, CMT
While not a part of Ichimoku, traders should watch the key RSI(5) bullish divergence at play on AUD/USD to see if this is enough to take AUD/USD to and through the cloud. Of the set-ups mentioned, Bullish AUD/USD is the lowest conviction as the daily chart still shows a countertrend move in play whereas the lagging line is above price from 26-days ago (March 18), but the price is below the cloud.
Recently, a hawkish slant in the RBA minutes and an upcoming employment report could kick-off a bullish move, but trend traders and not bottom feeders so this trade remains in wait-and-see mode with a bullish trigger developing on a move above the 61.8% retracement of the 2018 range at 79.50 US cents per AUD.
Not familiar with Fibonacci analysis, check out this insightful article
Adding to Ichimoku with IG Client Sentiment
Ichimoku has value in helping traders see and trade in the direction of a momentum-backed trend. Retail traders, at least when looked through the lens of IG Client Sentiment, tend to fight strong trends.
We often recommend backing your technical analysis with IG client sentiment as it can do a good job of helping you see sentiment backed moves, which tend to carry on for long periods, which can make for good trades if you’re on the right side.
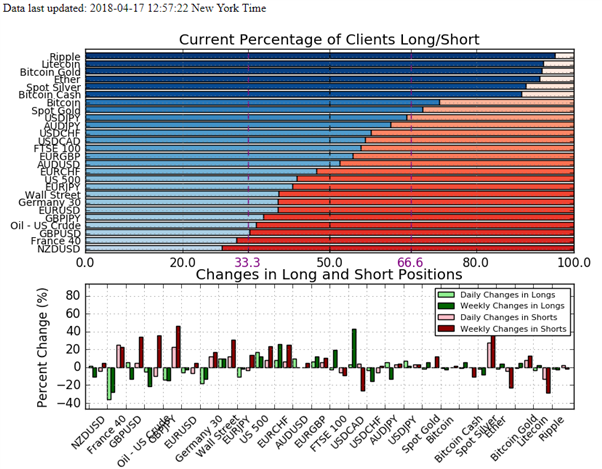
Source: IG CLIENT SENTIMENT data provided by IG
For those needing a refresher, Dailyfx will typically take a contrarian view to crowd sentiment, and when retail traders are building a net-short position, the signal is often triggered to buy or at least suggests prices may rise.
Recently, there has been a jump in GBPJPY and GBPUSD short positions that would favor further GBP appreciation that is in-line with Ichimoku analysis.
New to FX trading? No worries, we created this guide just for you.
---Written by Tyler Yell, CMT
Tyler Yell is a Chartered Market Technician. Tyler provides Technical analysis that is powered by fundamental factors on key markets as well as t1rading educational resources. Read more of Tyler’s Technical reports via his bio page.
Communicate with Tyler and have your shout below by posting in the comments area. Feel free to include your market views as well.
Discuss this market with Tyler in the live webinar, FX Closing Bell, Weekdays Monday-Thursday at 3 pm ET.
Talk markets on twitter @ForexYell
Join Tyler’s distribution list.


