


Ichimoku Technical Analysis Focus:
- CHF weakness accelerates against strong FX to Ichimoku junctures
- US Dollar Index fails at a pivotal point per Ichimoku after busy March open
- Commodity FX in focus as ‘Trade War’ headlines seek clarity
Ichimoku does a fabulous job of showing trend followers which trends are worth joining, and if nothing else, which trendsnot to fight. Currency, Swiss Franc weakness aligns with that description as CHF continues to fall aggressively against a handful of currencies, and Ichimoku has highlighted breaking down conditions for the last handful of trading sessions.
Want a full (& FREE) guide to walk you through Ichimoku? I created one here (click Advanced Guides)
Ichimoku has value in that it helps traders to see and trade in the direction of momentum. Retail traders, at least when looked through the lens of IG Client Sentiment, tend to fight strong trends. We often recommend backing your technical analysis with IG client sentiment as it can do a good job of helping you see sentiment backed moves, which tend to carry on for long periods, which can make for good trades if you’re on the right side.
EUR/CHF Moves Above Cloud After ECB Looks Forced To Rollback QE
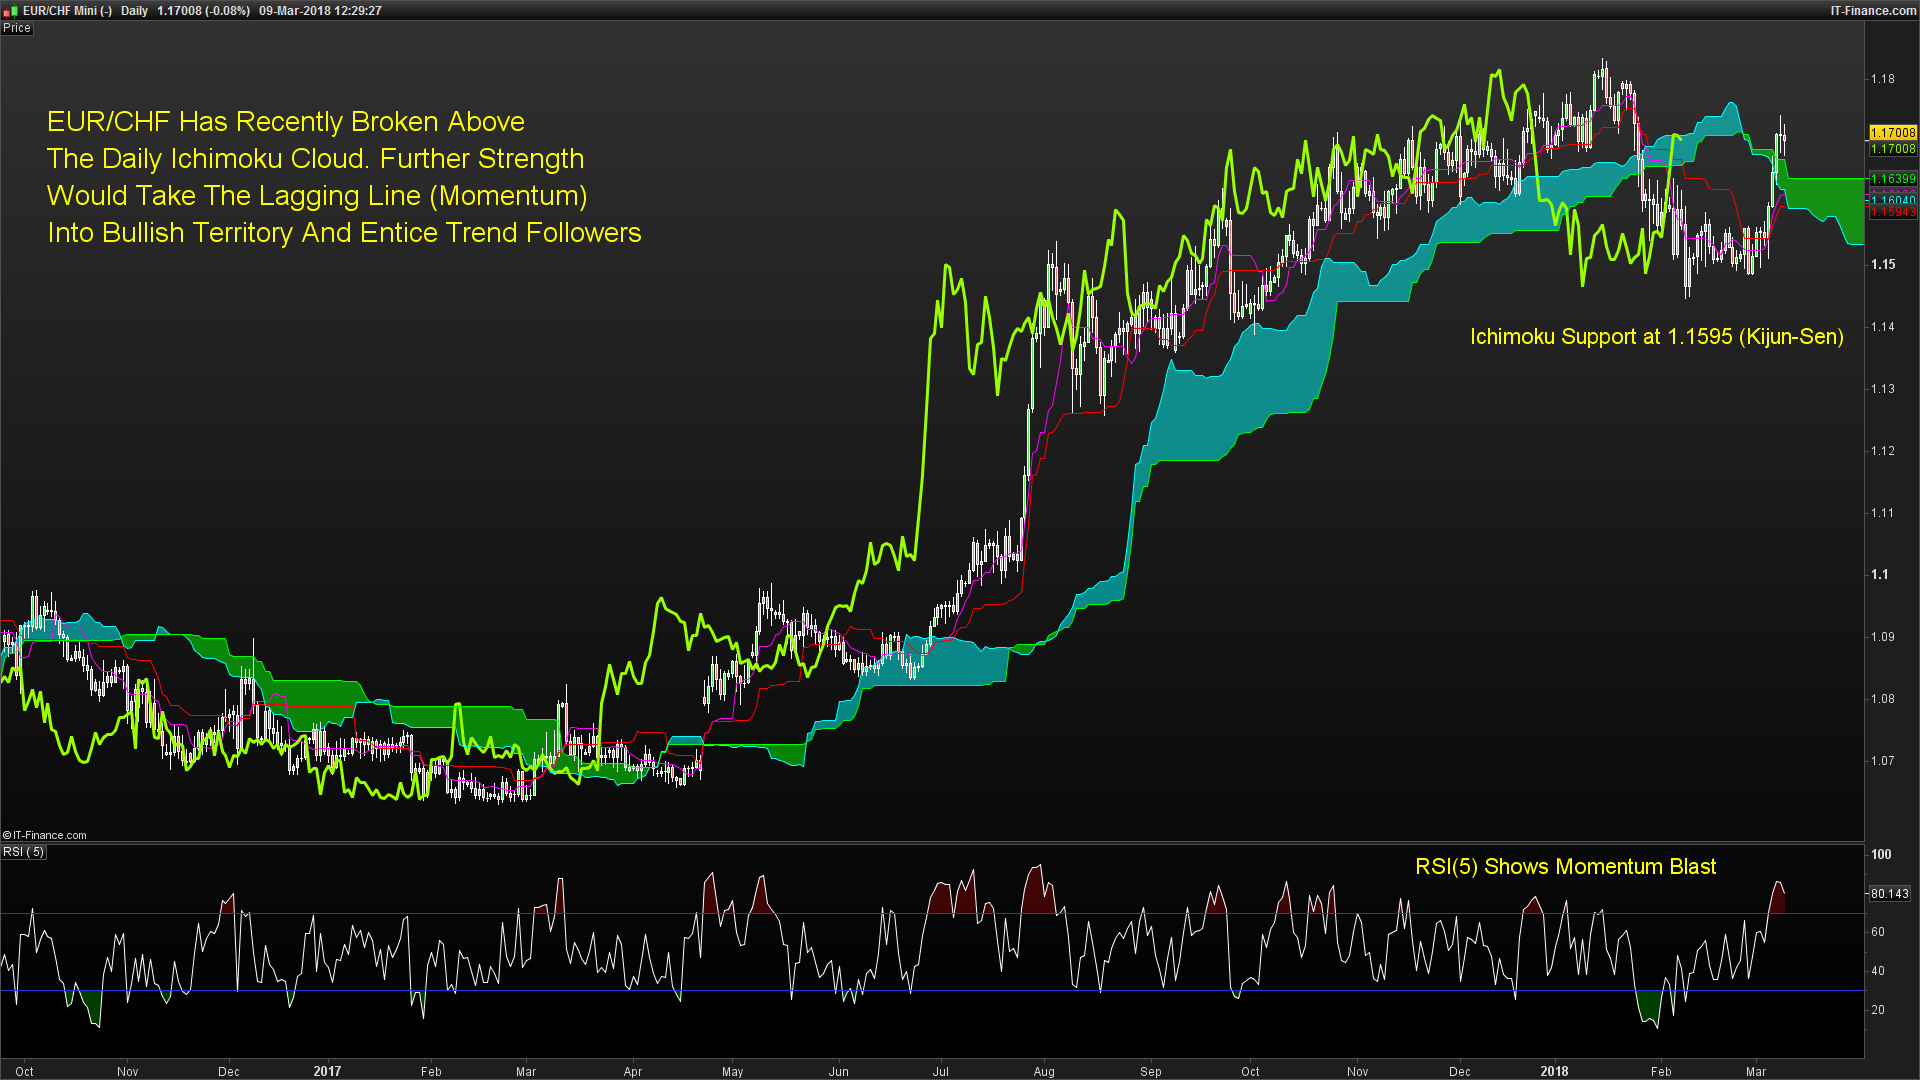
Chart Source: Pro Real Time with IG UK Price Feed. Created by Tyler Yell, CMT
EUR/CHF is recovering from a sharp pullback, thanks to the strengthening of haven currencies like the Swiss Franc in early February. Given the strong trend was seen on the chart, traders should be looking for signs of trend continuation higher.
Per Ichimoku, the lagging line (current candle close regressed 26-periods) is a key signal that the Bullish momentum is back. However, in addition to lagging line above price, traders that utilize Ichimoku also look to the lagging line in relation to the cloud. A lagging line break above the cloud, which is plotted forward 26-periods and discussed in detail in the DailyFX Ichimoku Guide (click Advanced Tab), would signal the current price has cleared multiple forms of resistance and could continue in the direction of the trend higher.
Adding RSI(5) to Ichimoku shows a momentum blast to the highest level since the trend accelerated aggressively led by the Euro last summer. Traders can look to the 26-day midpoint, called the Kijun-Sen at 1.1596 as support. A close below the Kijun-Sen could should the battle has yet to be won by the Bulls.
Looking to IG Client Sentiment for Insight on EUR/CHF
Lastly, EUR/CHF has a strong Bullish Signal per IGCS as seen here:

For those needing a refresher, we typically take a contrarian view of crowd sentiment, and the fact traders are net-long suggests EURCHF prices may continue to fall. Yet traders are less net-long than yesterday and compared with last week. Recent changes in sentiment warn that the current EURCHF price trend may soon reverse higher despite the fact traders remain net-long.
Always-Important USD Fails To Accelerate Through Ichimoku Cloud
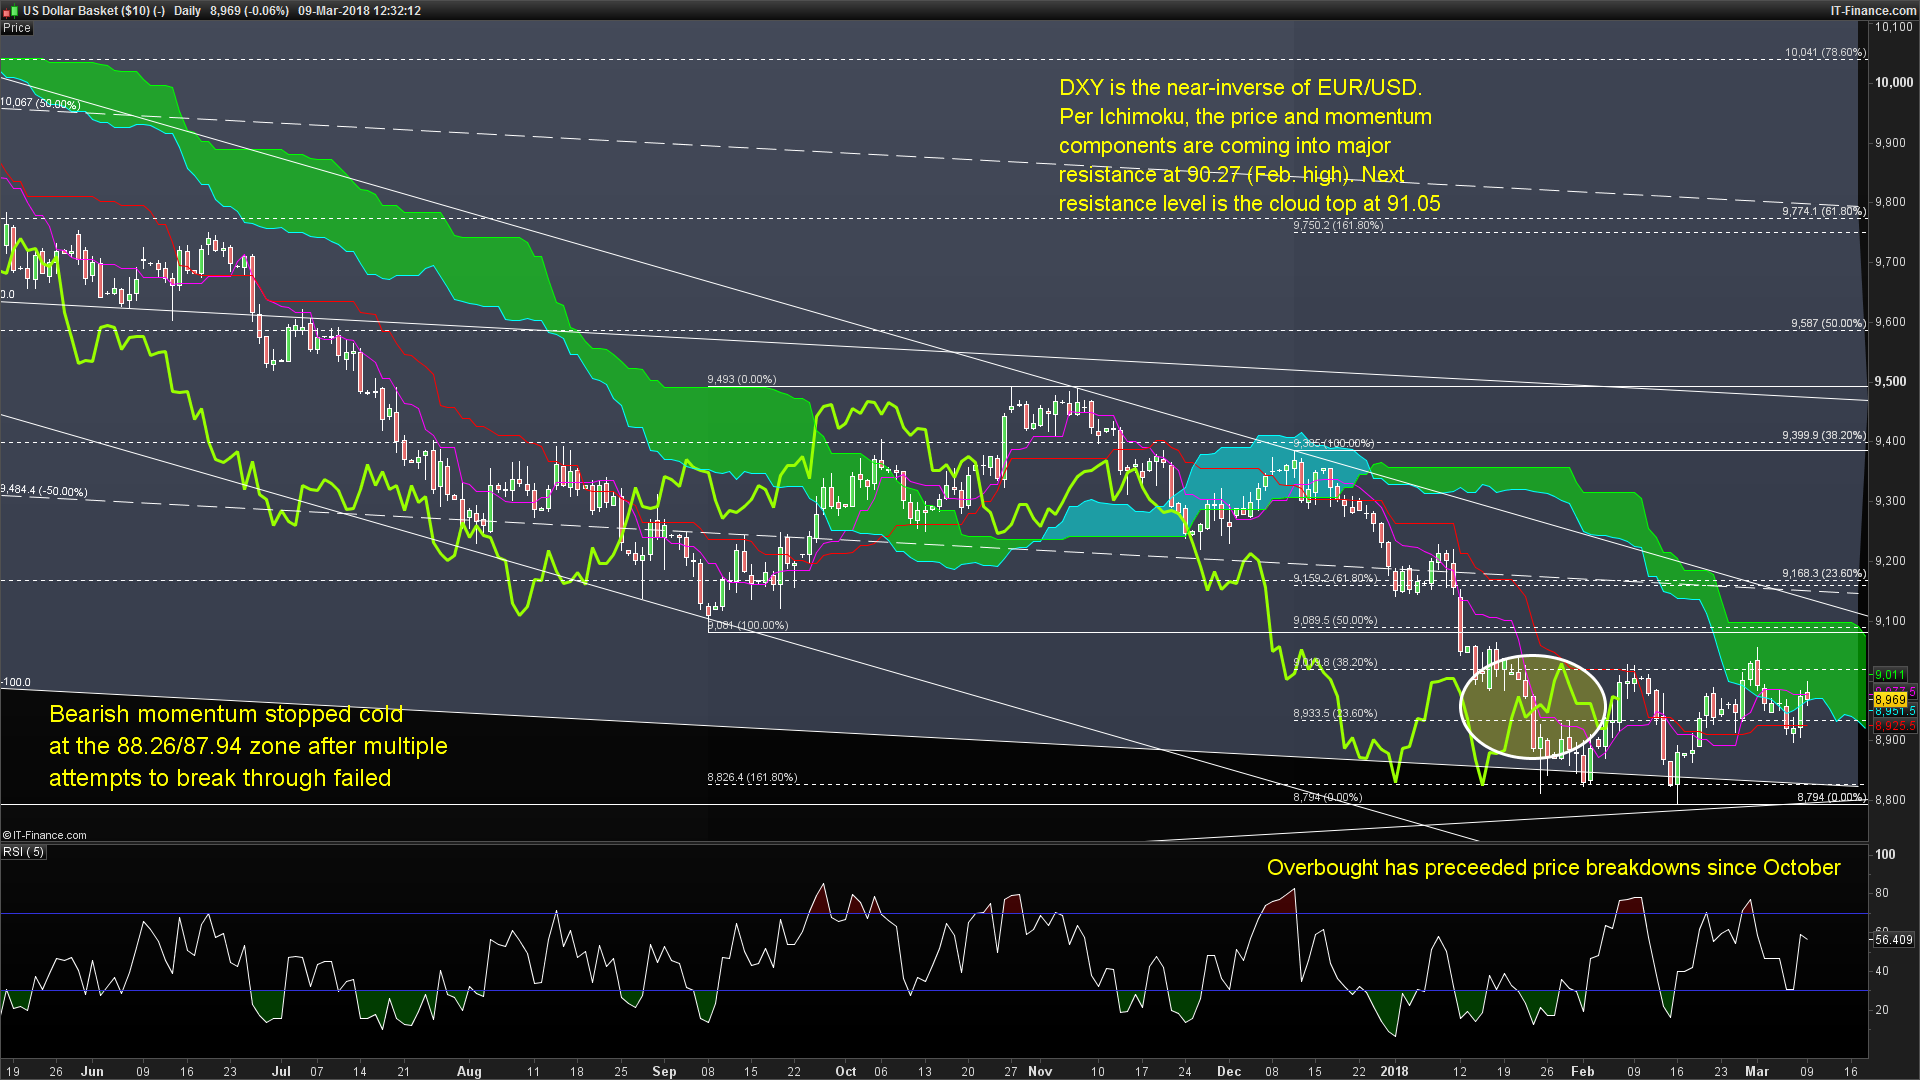
Chart Source: Pro Real Time with IG UK Price Feed. Created by Tyler Yell, CMT
Since late January, when risk markets topped, the Dollar Index has traded sideways. The risk-heart-attack in early February did little to lift the Dollar significantly and was likely caused by traders with a large short position locking in gains or taking money off the table.
After an aggressive drop that slowed in late January near the 88.30 zone, US Dollar Index has moved sideways, and recently into the Ichimoku cloud. The lagging line also recently broke above prior price, but that initially communicates a trend correction rather than a reversal. Additionally, if the lagging line breaks back below price, something to be witnessed if the price of DXY breaks below 89.25, the popular Dollar downtrend would be expected to continue.
March 1 marked the multi-month high for US Dollar, and early month price action can mark key pivots of support or resistance in the market. Traders would do well to heed the wisdom of Ichimoku and reserve their long-term Bullish view on USD if price continues to trade below the March 1 high of 90.57.
Rebound in Commodity FX in Proper Focus As Trump Tariff Details Become Clear
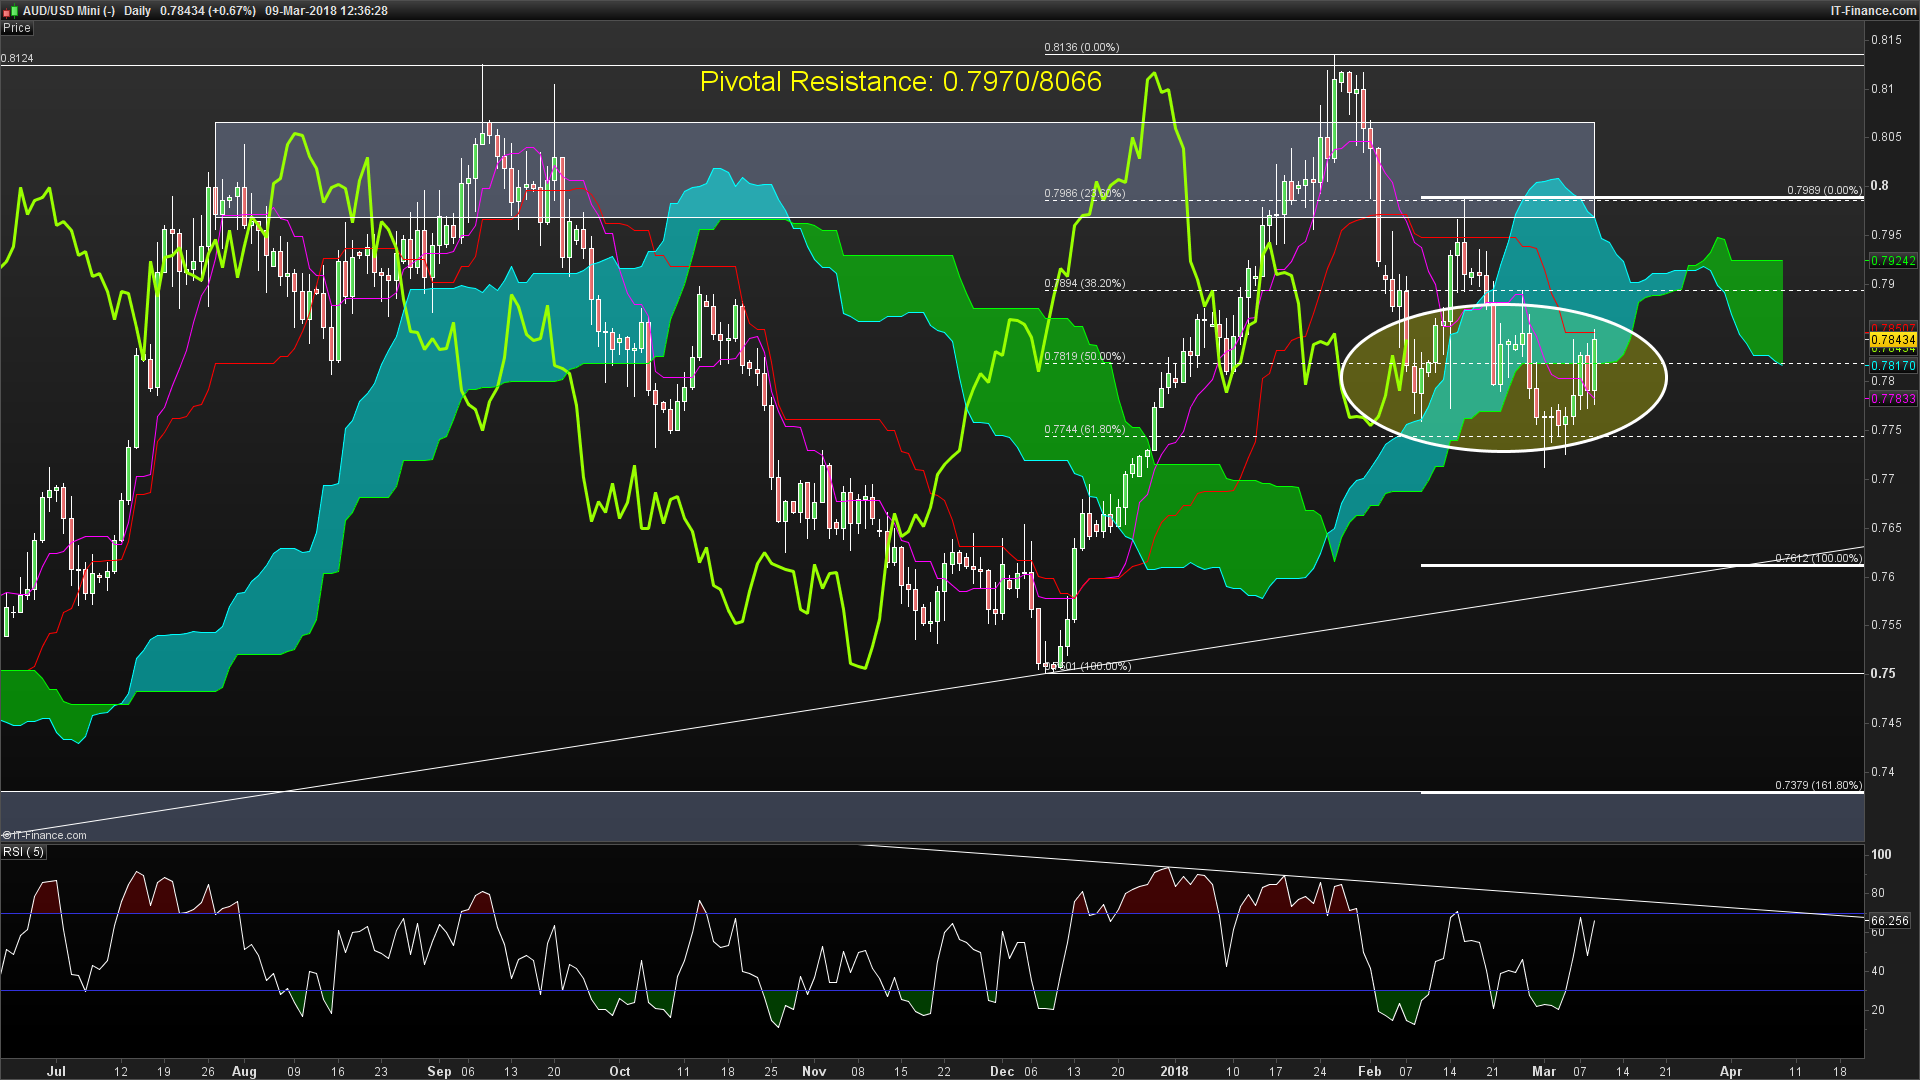
Chart Source: Pro Real Time with IG UK Price Feed. Created by Tyler Yell, CMT
The Australian Dollar has been in the crosshairs of a lot of talk about what will happen with global trade and demand on the back of news of Trump’s Tariff plan that was signed into US law on Thursday. The Australian Dollar is a key proxy for risk and the uncertainty of the US Dollar direction, though as discussed above, Ichimoku favors further weakness, so the rate naturally garners a lot of attention.
When looking to AUD/USD through the lens of Ichimoku, traders can see that price has broken below the cloud, but the lagging line did not. In other words, the strong pullback from ~81 US cents per AUD may be done. The price came down to retrace 61.8% of the December-January range, which is a deep, but often help pull-back level in advancing uptrends.
The key point of this chart is that a failure of the lagging line to breakdown so far means that the pullback may be down. The chart price patternmakes increasing exposure to AUD/USD difficult at this point, but the scales looked to be tipping in the bulls favor as Friday’s Non-Farm Payroll seems to have reignited the bulls and taken down fears that the Fed will aggressively hike over the next year to cool runaway inflation.
New to FX trading? No worries, we created this guide just for you.
---Written by Tyler Yell, CMT
Tyler Yell is a Chartered Market Technician. Tyler provides Technical analysis that is powered by fundamental factors on key markets as well as t1rading educational resources. Read more of Tyler’s Technical reports via his bio page.
Communicate with Tyler and have your shout below by posting in the comments area. Feel free to include your market views as well.
Discuss this market with Tyler in the live webinar, FX Closing Bell, Weekdays Monday-Thursday at 3 pm ET.
Talk markets on twitter @ForexYell
Join Tyler’s distribution list.


