


Technical Analysis via RSI Key Takeaways:
- US Dollar begins March overbought against weak-FX per RSI(3)
- JPY Strength seems to show volatility is here with passport-in-hand, and ready to stay
- Commodity FX may find March a hard month unless value buyers come to the table
Words can be deceiving for FX traders. Especially in trending markets when a trader hears the words overbought or oversold. When going through the Chartered Market Technician program, they do a good job of letting you know that an uptrend, one that should not be fought, will be overbought for an extended period of time. That is the logic that brought the great economist, but a reputably pitiful trader, John Maynard Keynes to say, “Markets can stay rational longer than you can stay solvent.”
Putting that bit of wisdom to practical use, overbought does not automatically mean you should be looking to sell. While it’s tempting to sell dear and buy cheap, there could also be a signal within the newly overbought conditions that traders often need to heed.
For example, last week, we painted the picture of an oversold Canadian Dollar as a theme that we could see persisting.
You can catch last week’s report here: FX Overbought/Oversold Report: Finding Opportunities in Extremes
Since then, there’s also been a development in the options market whereas traders are paying a premium to protect against outsized Canadian Dollar losses when compared to traders unwilling to pay a premium to protect against outsized Canadian Dollar gains. This backdrop has helped USD/CAD gain (CAD weakness) 220 pips at the time of this writing or 1.73% gain on the week.
Additionally, the Canadian Dollar has a significant correlation to commodities, which finished the roughest month since August on the back of USD strength, which we’ll soon touch on here.
As a reminder, this report will look to a foundational technical indicator, called the Relative Strength Index or RSI calculated over 3-periods to derive trading insights that can help with entries into a trade.
To learn how to manage your trades better, check out our free trading guides here
Overbought FX Pairs and Individual Currencies as of March 1, 2018
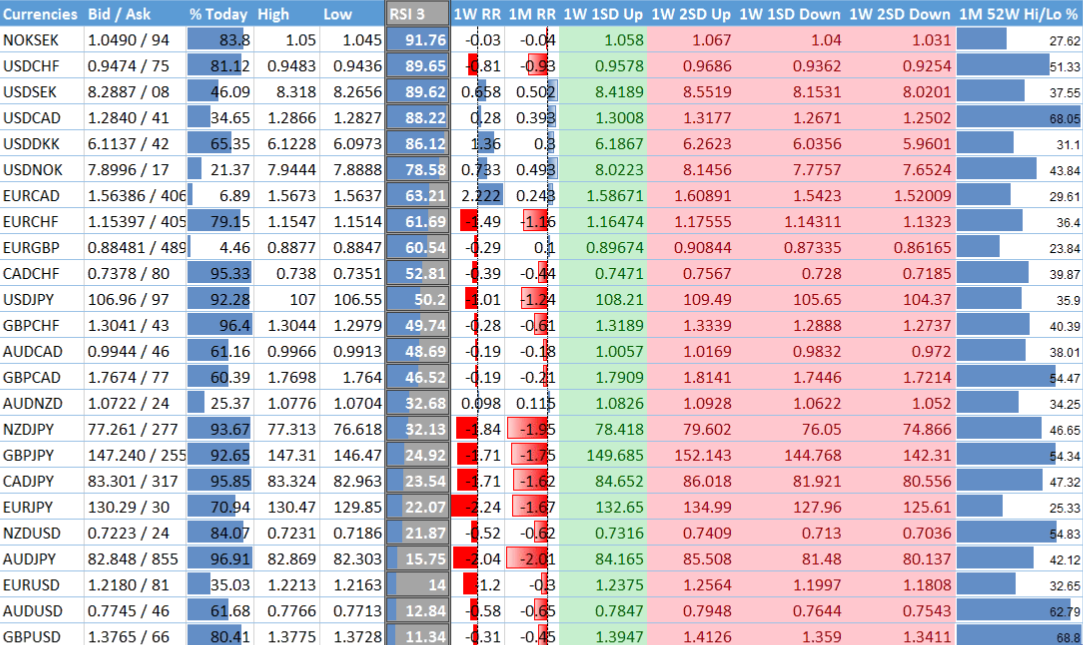
Data source: Bloomberg
Current FX Opportunities in Focus
US Dollar Immediately Stand Out on the Tails
A quick look above, and you can see that the 3-top oversold pairs (EUR/USD, AUD/USD, GBP/USD) per RSI(3) all show USD strength. On the opposite side of the distribution, 4 of the top-5 strongest per RSI(3) have USD taking them higher. NOKSEK is the only non-USD currency at the extremes.
What’s important about this move is that multiple institutional positioning indicators show an aggressively short US Dollar exposure. Given the pitiful returns, many likely showed in February after the volatility heart-attack that opened the month, a key risk has surfaced. The key risk would be further USD strength leading to a capitulation of the USD short trade by institutions that could send USD aggressively higher and continue to prolong the USD extremes on the RSI(3).
Following USD Strength? Keep an Eye on EUR/USD @ 1.21/033

Chart Source: ProRealtime, IG UK Price Feed. Created by Tyler Yell, CMT
Recently, a well-written analyst pick by our in-house Elliott Wave expert pick argued for a short-EUR/USD trade opportunity. Naturally, this would also play off a potential rebound in the US Dollar.
To see whether or not such a move is in play, traders should watch the thick support on EUR/USD at 1.2033/1.21 zone. A breakdown opens the possibility for an aggressive retracement that would likely have as a tailwind; theunwind of the institutional short position. Such an unwinding could see EUR/USD test 1.17, which is the 38.2% Fibonacci retracement of the 2017-2018 range.
Think Institutional Positioning Doesn’t Matter? Think Again

Data source: Bloomberg
In addition to the key strength of the USD, FX traders should be aware of the opportunities rising within a potentially strong JPY. Within the world of FX, everything seems to bow to the Yen. In other words, when capital flows see JPY strengthening, few are safe. Additionally, volatility shocks, like the one we saw in February are not necessarily a nail in the coffin of the bull market but can be seen as a harbinger of less complacency. Complacency was a key trait of 2017 and with it, also comes low volatility.
Now that complacency is likely gone, the JPY could continue to strengthen, and especially against susceptible commodity currencies like the Australian Dollar and Canadian Dollar or weaker European currencies like the Swedish Krona. A long-time and much-favored webinar member shared with me that CAD/JPY recently had its worst month in three-years. AUD/JPY is also near it’s the lowest level since June 2017 and is roughly 130 pips (at time of writing) from a key support zone. A break of this support at 81.50 would take AUD/JPY down to the lowest levels of November 2016.
A fascinating technical development of AUD/JPY has been the lack of extended downside momentum. The classical ‘death cross’ pattern where the 50-DMA is below the 200-DMA has failed to hold and has recently marked the bottom of AUD/JPY within a week. A break above the February 13 high, 85.60 would likely validate that this counter-pattern continues to hold.
AUD/JPY within an ATR of Very Strong Support and a Very Strong JPY
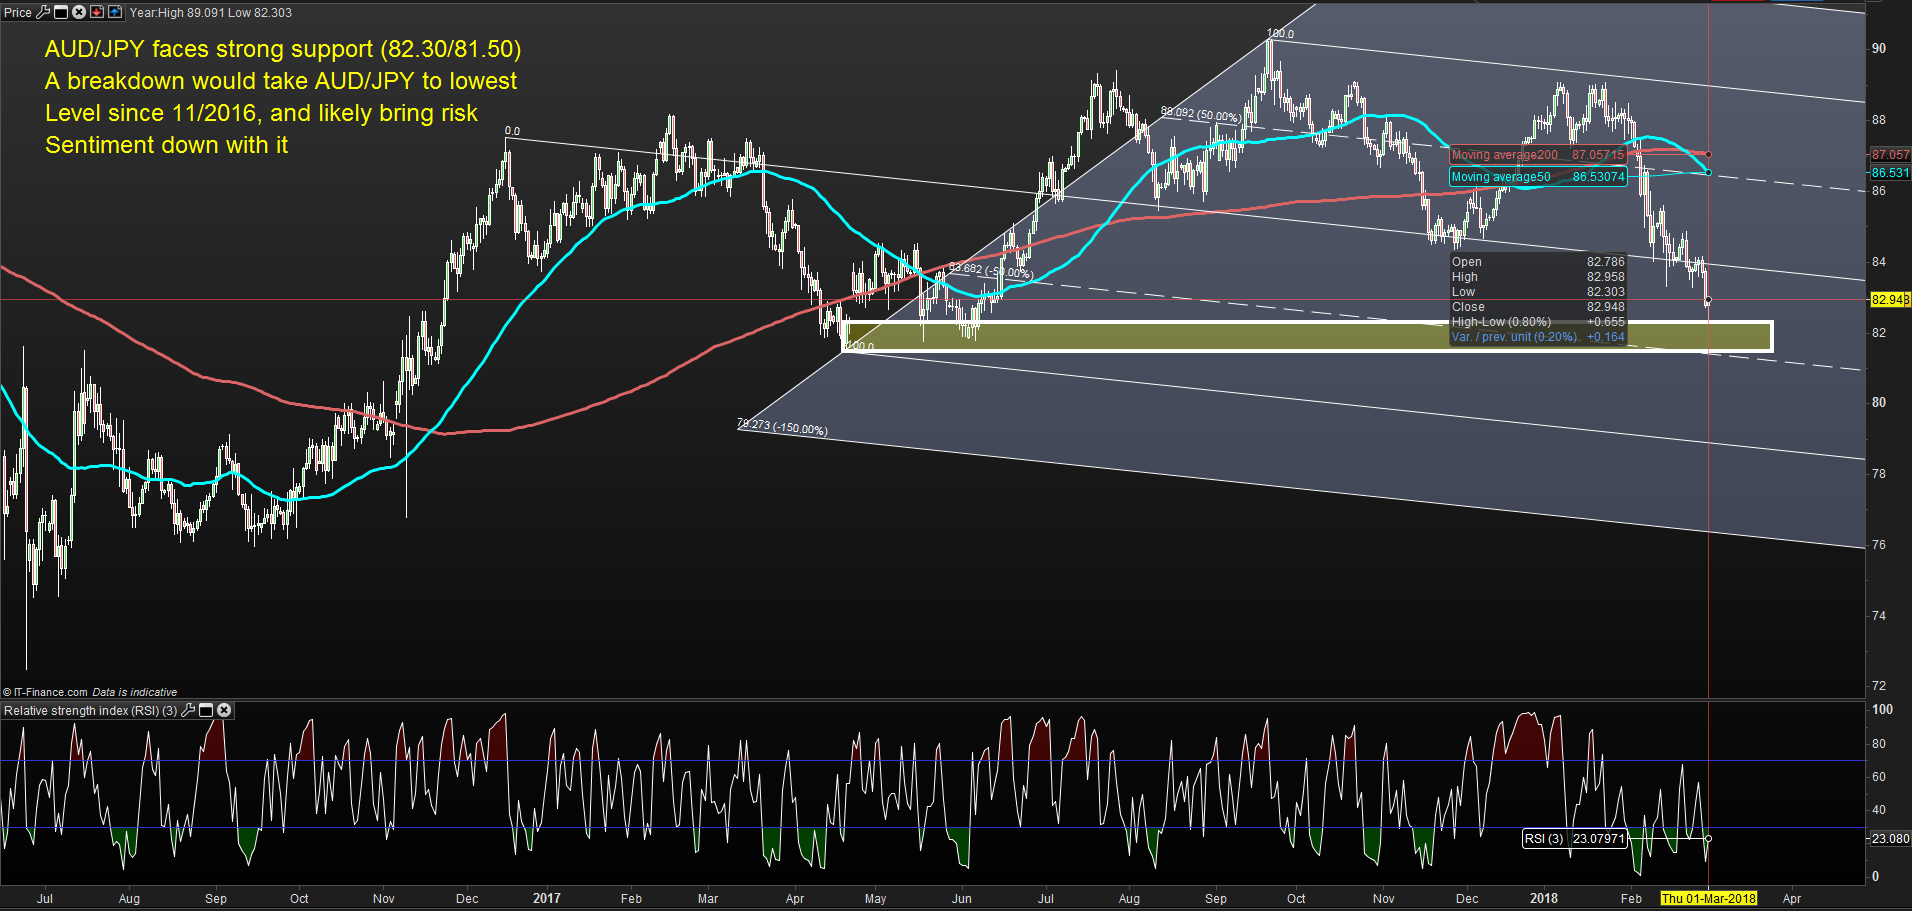
Chart Source: IG Charting Package, IG UK Price Feed. Created by Tyler Yell, CMT
Traders should hold the correlation of AUD/JPY and regional equities close at heart. A drop in AUD/JPY would likely also mean a drop in regional equities like the MSCI Asian Pacific Index, which has been a forerunner of confidence and growth.
Looking To Add More To This Analysis? Try IG Client Sentiment
Traders are Net-Long Suggesting GBPUSD Could Continue to fall (Contrarian)
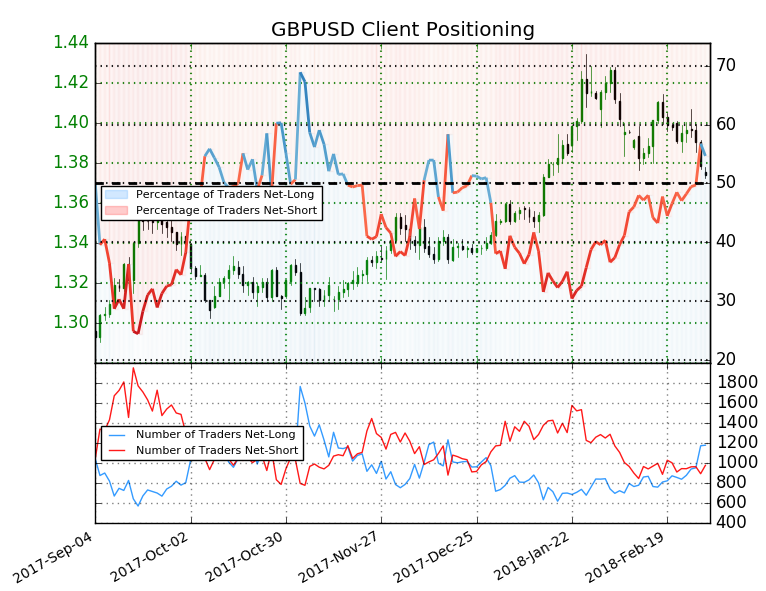
While simplicity is favored over complexity to the point of ruin, there may be a key benefit in adding sentiment analysis to your trading. Thanks to IG UK (parent of DailyFX,) you have access to the retail sentiment per actual positioning data that can help you see when traders are fighting strong trends that should possibly be bought rather than fought.
Retail Sentiment Signal on March 1: We typically take a contrarian view to crowd sentiment, and the fact traders are net-long suggests GBPUSD prices may continue to fall. Traders are further net-long than yesterday and last week, and the combination of current sentiment and recent changes gives us a stronger GBPUSD-bearish contrarian trading bias (Emphasis mine.)
Access Real-Time Sentiment Analysis Here
Explanation of Columns in My Technical Dashboard Above:
The key column per this report is the RSI(3) column, which is showing the current calculation of the short-term RSI on key currency pairs. The default RSI setting is 14, which makes up nearly 3-weeks of trading data. Naturally, a 3-period RSI is much more sensitive to current moves in the market as opposed to looking over the last 14-days.
Learn more about using and trading with the Relative Strength Index here
How I Use This Data In My Trading:
Being a fan of trading in the direction of the trend has taught me over the years to look for opportunities at a favorable price to enter in the direction of the trend. When using this data, I am looking for an oversold reading in a well-defined uptrend to identify favorable buying opportunities or an overbought reading in a well-defined downtrend to identify favorable selling opportunities.
Traditionally, a reading above 70 on RSI favors an overbought reading, while a reading below 30 signals an oversold reading. It’s worth noting that reversals are rare, so you want to be as aware of a new normal or trend breakout, as you do an extreme counter-trend reading that may present you an excellent risk-adjusted trading opportunity.
New to FX trading? No worries, we created this guide just for you.
---Written by Tyler Yell, CMT
Tyler Yell is a Chartered Market Technician. Tyler provides Technical analysis that is powered by fundamental factors on key markets as well as t1rading educational resources. Read more of Tyler’s Technical reports via his bio page.
Communicate with Tyler and have your shout below by posting in the comments area. Feel free to include your market views as well.
Discuss this market with Tyler in the live webinar, FX Closing Bell, Weekdays Monday-Thursday at 3 pm ET.
Talk markets on twitter @ForexYell
Join Tyler’s distribution list.


