


Ichimoku Technical Analysis Focus:
- US Dollar Index at pivotal point per Ichimoku ahead of busy March
- Cable breaks down to Feb. 9 low
- Cross Market Analysis: Looking To Upside In Gold
Last week, we introduced in the inaugural Ichimoku Report. The Ichimoku Report is designed to help you see developing technical opportunities that are backed by the dynamic trend following indicator that can be used as a complete technical trading system. Ichimoku does a brilliant job, while not predicting the future, of showing you trend bias, momentum, and key points of support and resistance in any liquid and traded market.
This week’s focus takes us to the US Dollar Index, which rose for the first month in four and has helped take EUR/USD to a six-week low. The next move in the DXY ahead of a busy March will be important for how institutions are positioned given evidence that they remain aggressively short USD after the 13% slide over the last 12-months.
Second, we’ll look at the breakdown in Cable (GBP/USD) and the Canadian Dollar with the latter trading to 2018 lows against many currencies. We’ll finish with a cross-market look to Gold, where a handful of technical studies point to a potential breakout.
Want a full (& FREE) guide to walk you through Ichimoku? I created one here (click Advanced Guides)
Ichimoku has value in that it helps traders to see and trade in the direction of momentum. Retail traders, at least when looked through the lens of IG Client Sentiment, tend to fight strong trends. We often recommend backing your technical analysis with IG client sentiment as it can do a good job of helping you see sentiment backed moves, which tend to carry on for long periods, which can make for good trades if you’re on the right side.
DXY (near-inverse of EUR/USD)– First Monthly Gain in Four Meets Ichimoku Resistance
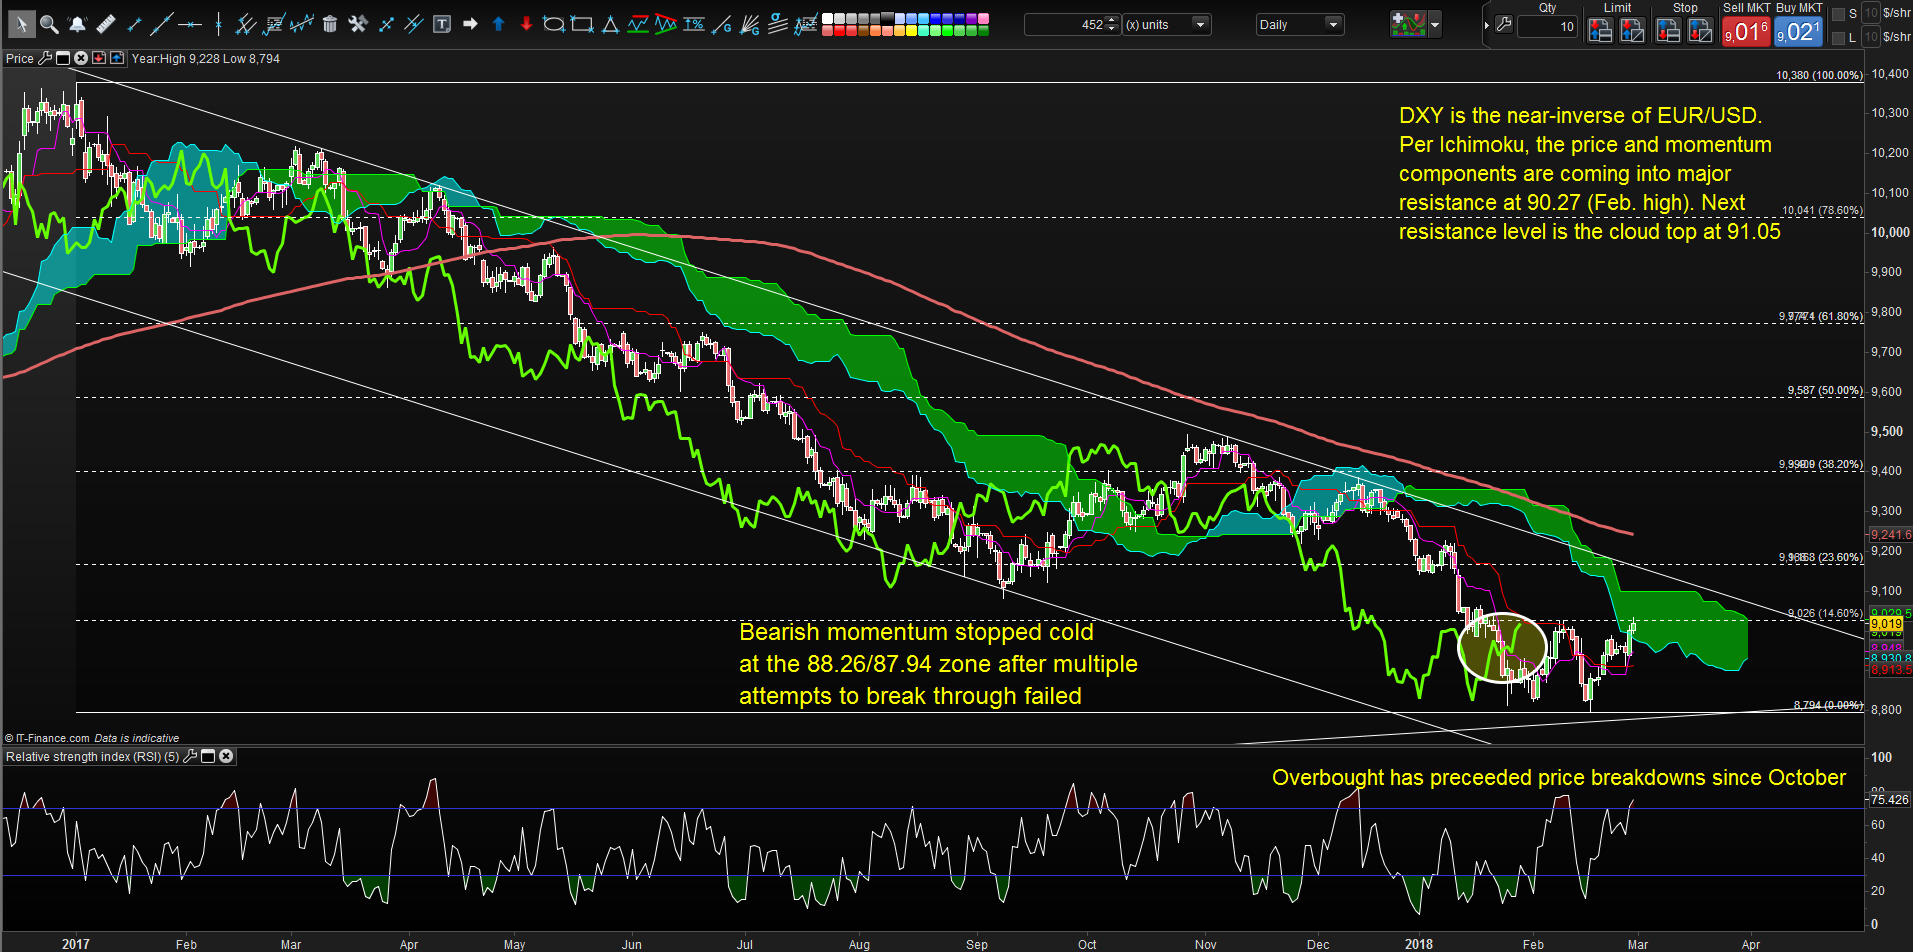
Chart Source: Pro Real Time with IG UK Price Feed. Created by Tyler Yell, CMT
Trending or correcting is a question often asked, and rightfully so. If the market is trending, when looking at DXY, the question becomes to buy in hopes of buying low. If the market is correcting, then traders should be looking for a weight of evidence that the broader downtrend is continuing so the traders can take advantage of the move.
The US Dollar Index is coming into a slew of resistance at 90.27, the prior-February high before piercing on the last trading day of the month. While a minor Fibonacci resistance level, 90.26 also marks the 14.6 (.382^2), and most importantly, aligns with the Ichimoku Cloud on the daily chart.
The lagging line is showing a premium to the price of 26-days ago, which favors a correction in play. Only when the lagging line breaks above the cloud, is a bullish reversal seen as in-play. As such, traders can look for a move above ~91.30 to favor that a broader base is in at 88. Below 91.30, traders should look for opportunities to catch the next leg lower to 87.91/70.
GBP/USD – Deep Correction Meets Ichimoku Cloud

Chart Source: Pro Real Time with IG UK Price Feed. Created by Tyler Yell, CMT
The price of Sterling has been a point of consternation for traders for a while as it has ridden high off the weak USD. On Wednesday, the price of GBP/USD tested the February low, and a further breakdown is expected to see a test of the ABC (100% Fibonacci Expansion) target of 1.3564 or the 2018 low of 1.3458. Fundamentally, the BoE hike seems to be doing little to help GBP bulls out as economic woes could continue if the recent threats from EU’s chief Brexit negotiator come to pass.
Traders may wish to look to stronger currencies to play GBP weakness or weaker currencies should GBP bounce from support. Commodity FX marks weak currencies as of the end of February and the strongest currency for the month of February goes to the JPY.
When looking at Ichimoku, The price is sitting right at the cloud base at 1.3785. The resistance points from Ichimoku studies are the 9-period midpoint and the 26-period midpoint at 1.3992 and 1.4021 respectively. On the chart above, you can see that the lagging line is below price. Therefore, for bulls to regain bragging rights andto swell account equity, they would need to see the lagging line break above the price from 26-periods ago and price break above the 9-&26-period midpoint.
Cross-Market Analysis: XAU/USD– Why Gold Should Be On Breakout Watch
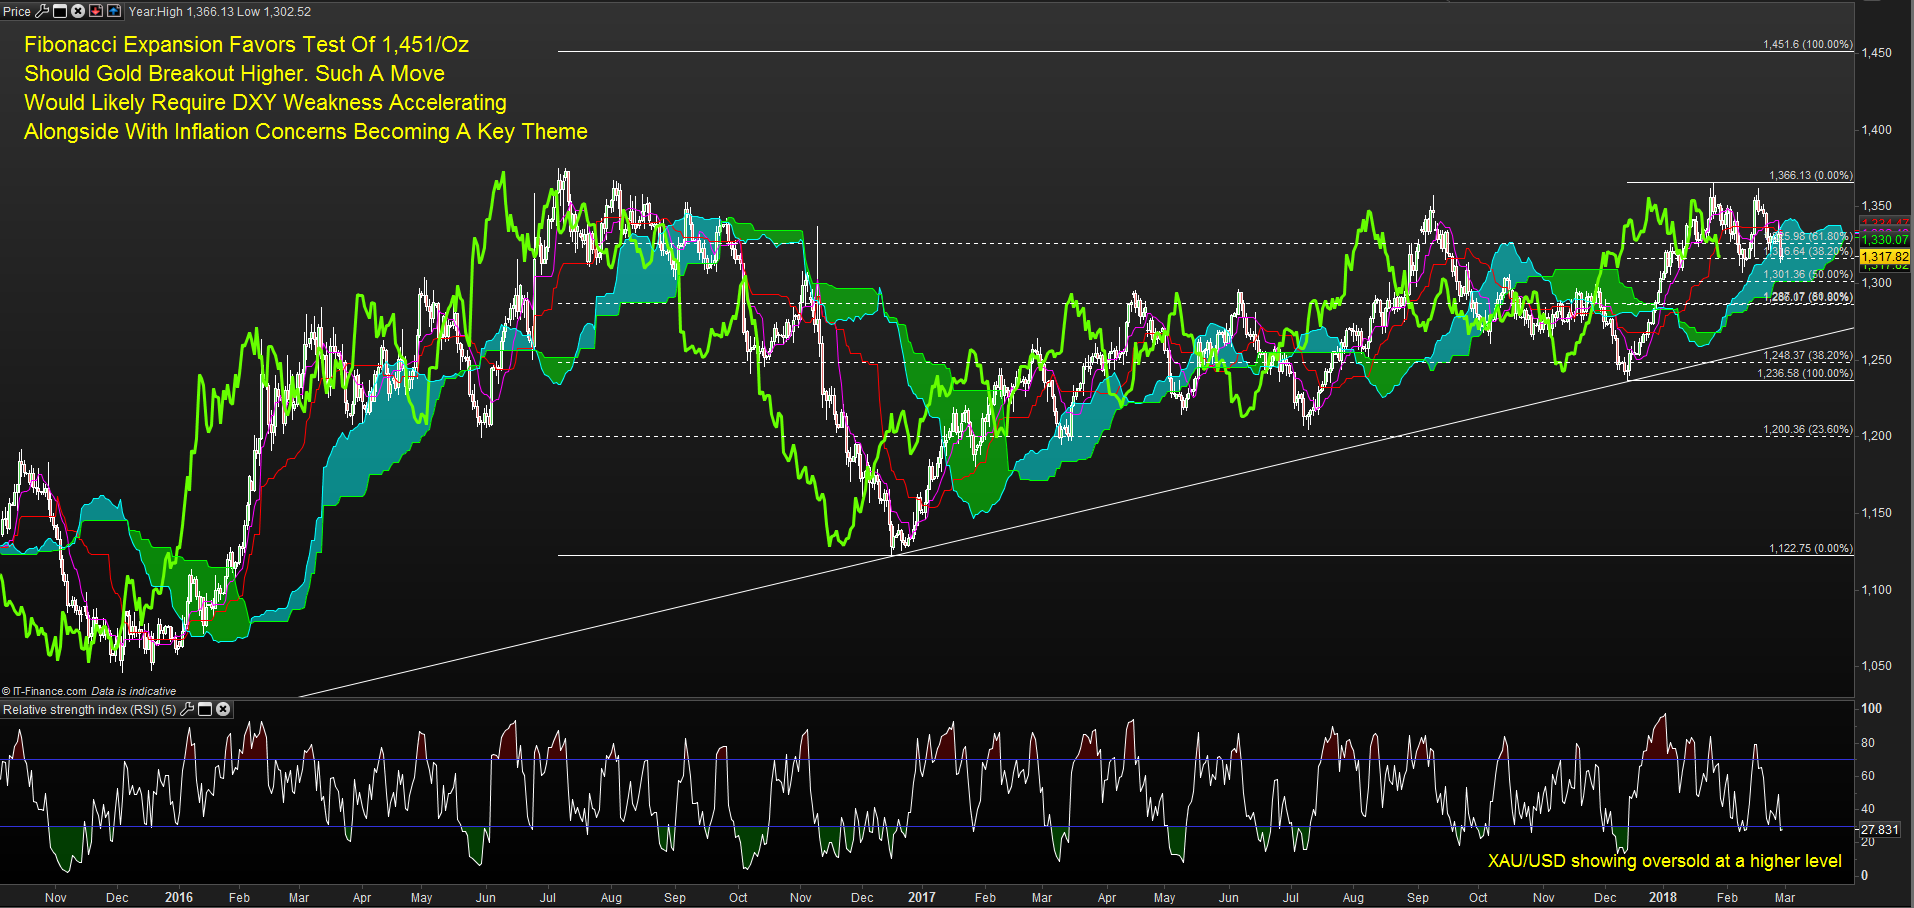
Chart Source: Pro Real Time with IG UK Price Feed. Created by Tyler Yell, CMT
After nearly a year of consolidating sideways, Gold looks ripe to make a big move. Ichimoku shows a correction in play right now as the lagging line is below price from 26-days ago. However, the RSI(5) provides additional insight alongside other technical studies that can provide depth to what we see with Ichimoku.
In short, XAU/USD is showing oversold per RSI(5) from the highest level since August 2016, and the consolidation is pushing up to resistance. A Fibonacci study shows a breakout target at $1,451 (current spot at $1,317/oz.)
Gold has had a poor showing in February along with other risk assets across the world. Ichimoku resistance per the 9- & 26- period mid-point is at 1,332/34. A close above these levels in early March could not only bring us out of a nearly year-longconsolidation but could be the first serious attempt toward $1,451.
Traders that favor Elliott Wave may want to keep an eye on what happens if price and the lagging line break below the cloud. An excellently written analysis of Gold through the lens of Jeremy Wagner, CEWA-M show that a failure to breakout above $1,350 in Gold could precipitate a large drop in the yellow metal.
Elliott Wave Forecast for Gold, Silver, and Yen Paint Bullish USD Picture
New to FX trading? No worries, we created this guide just for you.
---Written by Tyler Yell, CMT
Tyler Yell is a Chartered Market Technician. Tyler provides Technical analysis that is powered by fundamental factors on key markets as well as t1rading educational resources. Read more of Tyler’s Technical reports via his bio page.
Communicate with Tyler and have your shout below by posting in the comments area. Feel free to include your market views as well.
Discuss this market with Tyler in the live webinar, FX Closing Bell, Weekdays Monday-Thursday at 3 pm ET.
Talk markets on twitter @ForexYell
Join Tyler’s distribution list.


