


Price & Time covers key technical themes daily and can be delivered to your inbox each morning by joining the distribution list: Price & Time
Talking Points
- Long-term cycles suggest caution
- 116.00 and 126.00 critical in 2016
Looking for real-time forex market sentiment? Get it HERE
USD/JPY: The Big Picture Tea Leaves
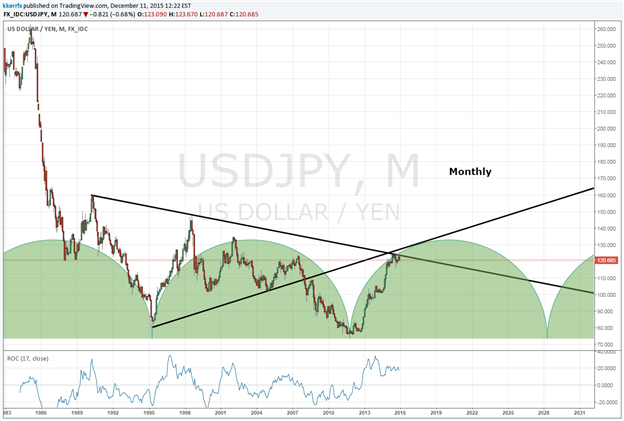
I am not the biggest fan of fixed length cycles, but they certainly do exist. One of the clearest fixed lengths is in USD/JPY as the low-to-low move from late 1978 to the spring of 1995 lasted right around 16.5 years. The next low-to-low cycle from 1995 to 2011 lasted, as you probably have already guessed, 16.5 years. The brevity and ferocity of the upward portion of these low-to-low cycles is what I really wanted to focus on today as I see it as a fairly clear potential negative overhang going forward at least in a longer-term sense.
For instance, the move off the 1978 low only lasted some 48 months and rallied over 55%. The duration of the advance off the 1995 low was even less at 40 months, but USD/JPY rallied a whopping 85% during that time. Using these prior two episodes as a guide, it would seem the advance in USD/JPY is long in the tooth, if not already over. From the October 2011 low, the exchange rate rallied 44 months to this year’s high near 126.00. Interestingly this was right in the middle of the amount of time of the prior two episodes. The percentage move off the 2011 low is also similar as the June high marked a move of some 66.5% off the October 2011 low – a little less than the average of the other two run-ups.
The price levels where we stopped are also worth noting. My fellow DailyFX technician, Jamie Saettele, has pointed out several times this year that the reversal around 126.00 came at a very nice resistance zone at it marked a clear convergence of the downward sloping trendline connecting the 1990 and 1998 highs and the internal trendline that connects the 1995 and 2005 lows. Jaimie also points out that there is a tendency in the rate for there to be important turns every 10 years (1995, 2005, and 2015?) I would be lying if I did not say all this has me starting to make me think that another important down cycle could have started. I know the so-called “fundamentals” suggest USD/JPY can only go up from here, but the “tea leaves” are starting to show something different. Whatever the case, the big levels in 2016 look pretty clear. Over 126.00 invalidates most of what I wrote. Under 116.00 likely ushers in a decline that will catch many by surprise.
--- Written by Kristian Kerr, Senior Currency Strategist for DailyFX.com
To contact Kristian, e-mail instructor@dailyfx.com. Follow me on Twitter @KKerrFX


