


Talking Points
- EUR/USD breaks below 50-day moving average
- NZD/USD testing key retracement
- USD/JPY overcomes important long-term retracement
Get real time volume on your charts for free. Click HERE
Foreign Exchange Price & Time at a Glance:
Price & Time Analysis: EUR/USD
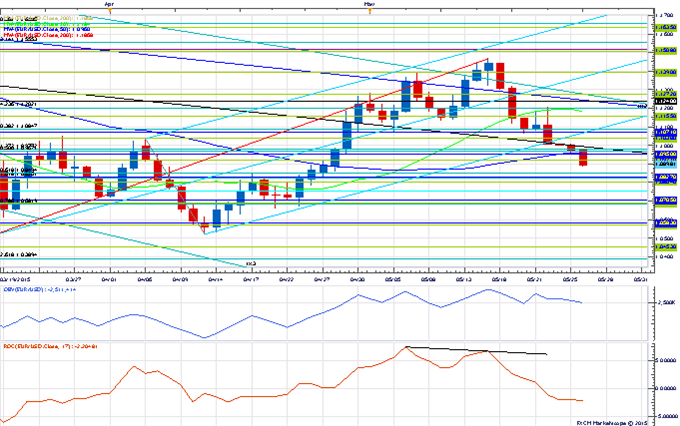
Charts Created using Marketscope – Prepared by Kristian Kerr
- EUR/USD broke below the 50-day moving average today to record a new low for the month
- Our near-term trend bias is lower in the euro while below 1.1200
- A 61.8% retracement of the March-May advance at 1.0850 is the next downside pivot of note
- A very minor cycle turn window is eyed Thursday
- A close above 1.1200 would turn us positive on the euro again
EUR/USD Strategy: Like selling on strength against 1.1200.
| Instrument | Support 2 | Support 1 | Spot | Resistance 1 | Resistance 2 |
|---|---|---|---|---|---|
| EUR/USD | 1.0710 | *1.0850 | 1.0900 | 1.0950 | 1.1040 |
Price & Time Analysis: NZD/USD
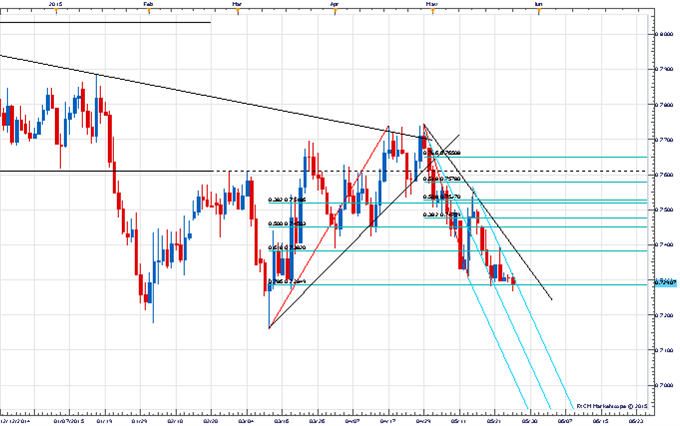
Charts Created using Marketscope – Prepared by Kristian Kerr
- NZD/USD probed below the 78.6% retracement of the March – April advance at .7285 to record its lowest level in two months today
- Our near-term trend bias remains lower while below .7385
- A close under .7285 is needed to set off the next leg lower in the rate
- A very minor turn window is eyed today
- A daily close over .7450 would turn us positive on the Kiwi
NZD/USD Strategy: Like holding only reduced short positions while below .7385
| Instrument | Support 2 | Support 1 | Spot | Resistance 1 | Resistance 2 |
|---|---|---|---|---|---|
| NZD/USD | .7235 | *.7285 | .7290 | .7315 | *.7385 |
Focus Chart of the Day: USD/JPY
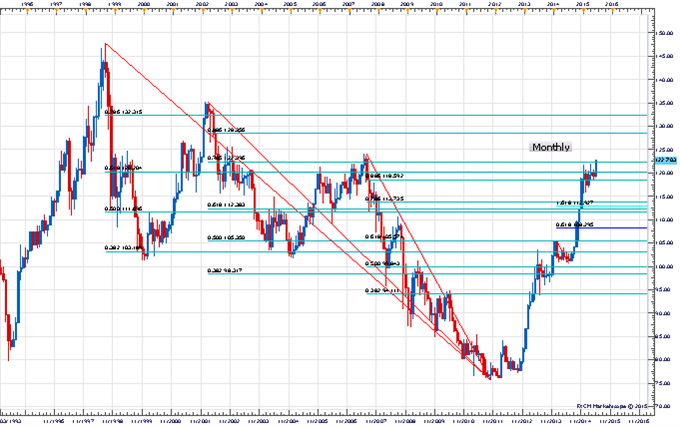
USD/JPY overcame the 78.6% retracement of the 2002-2011 decline near 122.40 this morning to touch its highest level in almost eight years. The clear pattern in the exchange rate since 2011 has been to consolidate for months at a time around long-term Fibonacci levels before making its way higher again. Given this latest push higher is coming on the heels of six months of consolidation one has to wonder if this is the start of another impulsive move to the upside. A weekly/monthly close above 122.40 (and ideally above the 2007 high of 124.13) would further confirm the breakout and set the stage for a push towards the next long-term Fibonacci level around 128.35. Only aggressive weakness back under 120.55 would call into question the positive view.
To receive Kristian’s analysis directly via email, please SIGN UP HERE.
--- Written by Kristian Kerr, Senior Currency Strategist for DailyFX.com
This publication attempts to further explore the concept that mass movements of human psychology, as represented by the financial markets, are subject to the mathematical laws of nature and through the use of various geometric, arithmetic, statistical and cyclical techniques a better understanding of markets and their corresponding movements can be achieved.
To contact Kristian, e-mail instructor@dailyfx.com. Follow me on Twitter @KKerrFX


