


Talking Points
- USD/JPY fails near last month’s closing high
- USDOLLAR rally stalls at Fib retracement
- S&P 500 turns down after key timing relationship
Get real time volume on your charts for free. Click HERE
Foreign Exchange Price & Time at a Glance:
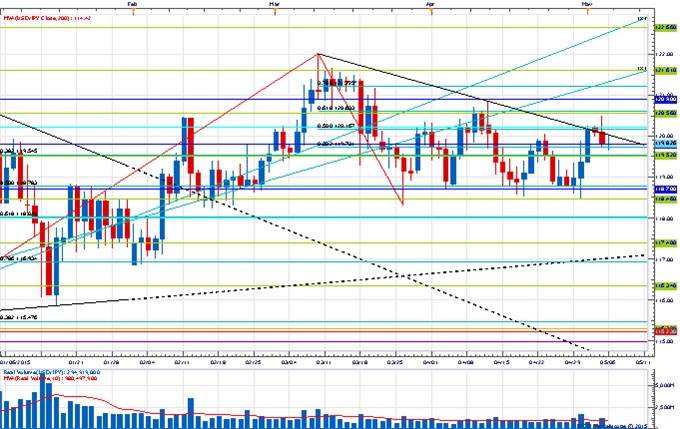
Price & Time Analysis: USD/JPY
Charts Created using Marketscope – Prepared by Kristian Kerr
- USD/JPY failed yesterday just below the April closing high at 120.55
- Our near-term trend bias is lower while below 121.00
- Immediate support is seen around 119.55, but weakness below 118.40 is really needed to trigger any sort of meaningful move to the downside
- A minor cycle turn window is eyed around the end of the week
- A close above 121.00 would turn us positive on USD/JPY
USD/JPY Strategy: Like holding only a reduced short positions while below 121.00
| Instrument | Support 2 | Support 1 | Spot | Resistance 1 | Resistance 2 |
|---|---|---|---|---|---|
| USD/JPY | *118.40 | 119.55 | 119.80 | 120.15 | *121.00 |
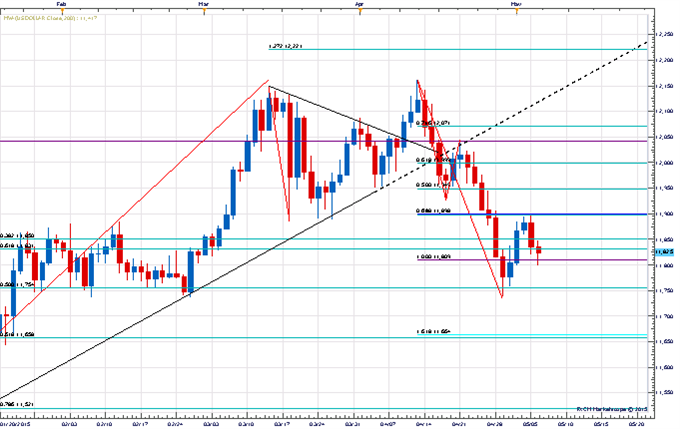
Price & Time Analysis: FXCM US DOLLAR INDEX
Charts Created using Marketscope – Prepared by Kristian Kerr
- USDOLLAR failed yesterday at the 38% retracement of the April range in the 11,900 area
- Our near-term trend bias is lower in the index while below 11,900
- A move under Fibonacci support near 11,755 is needed to set off the next leg lower in the basket
- An important turn window is seen here
- A daily close back over 11,900 would turn us positive on the index
USDOLLAR Strategy: Like reducing short positions into this turn window.
| Instrument | Support 2 | Support 1 | Spot | Resistance 1 | Resistance 2 |
|---|---|---|---|---|---|
| USDOLLAR | *11,755 | 11,780 | 11,825 | 11,850 | *11,900 |
Focus Chart of the Day: S&P 500
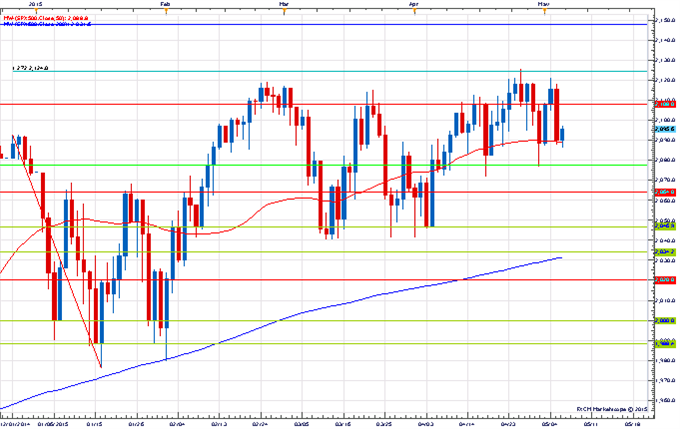
The high in the S&P 500 last week had some nice cyclical symmetry. There were 2757 days between the 2000 and 2007 highs in the index and last week’s high occurred on day 2755 from the 2007 high (close enough for government and cycle work). Just how important this turn proves to be is still up in the air, but Monday’s successful back test keeps the door open to a deeper correction. The 50-day moving average near 2090 and last week’s low around 2076 are clear near-term pivots, but the truly important area of support looks to be between 2030/40 as this zone marks a nice convergence of the recent range lows and the 200-day moving average. Weakness below there would suggest a much more important correction is unfolding. Strength through 2126 is needed to invalidate the negative cycle at work and re-focus attention higher in the index.
To receive Kristian’s analysis directly via email, please SIGN UP HERE.
--- Written by Kristian Kerr, Senior Currency Strategist for DailyFX.com
This publication attempts to further explore the concept that mass movements of human psychology, as represented by the financial markets, are subject to the mathematical laws of nature and through the use of various geometric, arithmetic, statistical and cyclical techniques a better understanding of markets and their corresponding movements can be achieved.
To contact Kristian, e-mail instructor@dailyfx.com. Follow me on Twitter @KKerrFX


