


Talking Points
- EUR/USD probes above 1.1000
- GBP/USD trades at highest level in almost two months
- Attitude shift in Gold or just a squeeze?
Get real time volume on your charts for free. Click HERE
Foreign Exchange Price & Time at a Glance:
Price & Time Analysis: EUR/USD
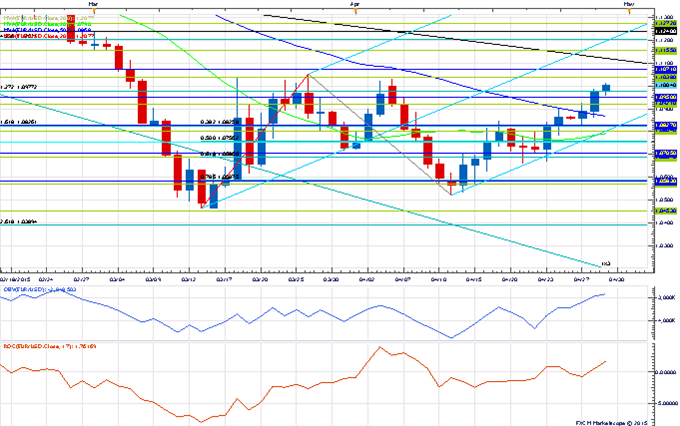
Charts Created using Marketscope – Prepared by Kristian Kerr
- EUR/USD contiued its advance this morning to probe above 1.1000
- Our near-term trend bias remians higher while above 1.0810
- A slew of Gann levels between 1.1040 and 1.1070 suggest this remains a key pivot area
- A minor cycle turn window is eyed today
- A close over below 1.0810 would turn us negative again on the euro
EUR/USD Strategy: Like buying on weakness against 1.0810.
| Instrument | Support 2 | Support 1 | Spot | Resistance 1 | Resistance 2 |
|---|---|---|---|---|---|
| EUR/USD | *1.0810 | 1.0930 | 1.1000 | 1.1040 | *1.1070 |
Price & Time Analysis: GBP/USD
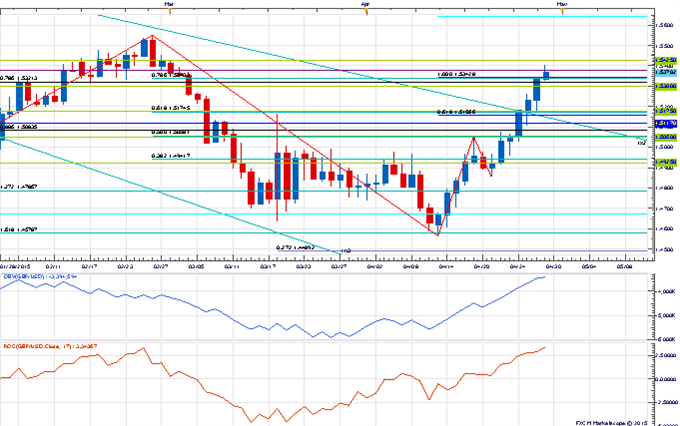
Charts Created using Marketscope – Prepared by Kristian Kerr
- GBP//USD broke above the 78.6% retracement of the February/April decline today to tade at its highest level in almost two months
- Our near-term trend bias is higher in cable while over 1.5175
- A move through 1.5425 is now neeeded to trigger the next leg higher in the rate
- A minor turn window is seen today
- A daily close below 1.5175 would turn us negative on the pound
GBP/USD Strategy: Like the long side while over 1.5175
| Instrument | Support 2 | Support 1 | Spot | Resistance 1 | Resistance 2 |
|---|---|---|---|---|---|
| GBP/USD | *1.5175 | 1.5340 | 1.5375 | *1.5425 | 1.5530 |
Focus Chart of the Day: GOLD
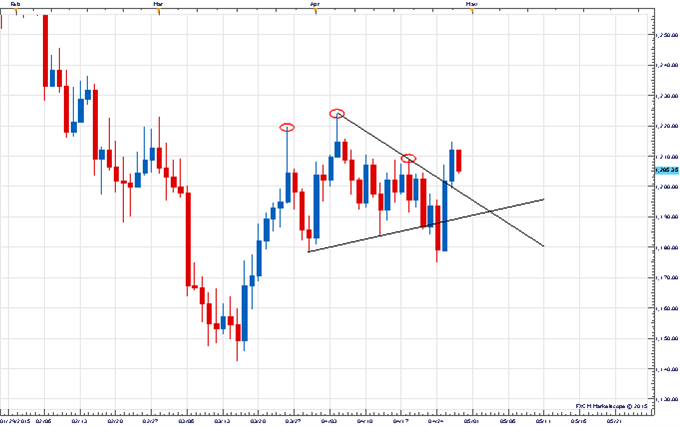
We have spent a lot of ink over the past weeks writing about patterns and their various implications. We continue with that theme today as the recent price action in Gold shows that some of the sharpest moves in markets often stem from patterns that don’t work out. Late last week XAU/USD triggered a fairly clear minor head & shoulders pattern on the move through 1186. The daily/weekly close below the neckline likely enticed even more shorts into the market. It all proved to be a trap as the move on Monday forced a pretty severe squeeze as the rally back over the neckline and right shoulder invalidated the pattern. Often times false pattern breaks signal an important shift in market sentiment and there is a good chance that this position squeeze could morph into a more meaningful move higher. A clear break of 1225 within the next few days would signal that such a move is underway. On the flipside, it would take a break of 1175 to turn the immediate technical picture negative again.
To receive Kristian’s analysis directly via email, please SIGN UP HERE.
--- Written by Kristian Kerr, Senior Currency Strategist for DailyFX.com
This publication attempts to further explore the concept that mass movements of human psychology, as represented by the financial markets, are subject to the mathematical laws of nature and through the use of various geometric, arithmetic, statistical and cyclical techniques a better understanding of markets and their corresponding movements can be achieved.
To contact Kristian, e-mail instructor@dailyfx.com. Follow me on Twitter @KKerrFX


