


Talking Points
- EUR/USD cracks key moving average
- AUD/USD trades to highest level in over a month
- USDOLLAR triggers reversal
Get real time volume on your charts for free. Click HERE
Foreign Exchange Price & Time at a Glance:
Price & Time Analysis: EUR/USD
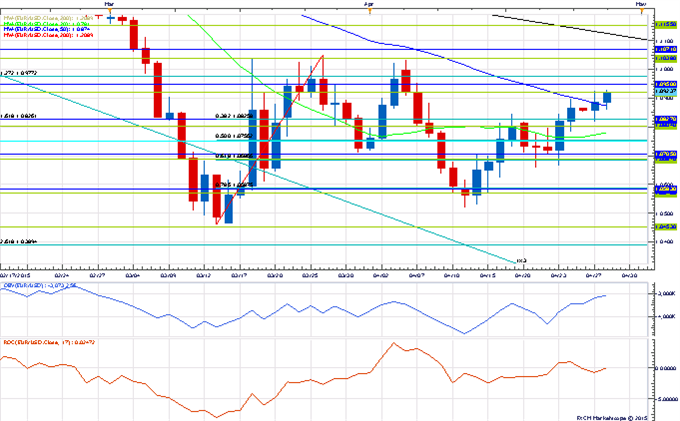
Charts Created using Marketscope – Prepared by Kristian Kerr
- EUR/USD has traded steadily higher since finding support around the 78.6% retracement of the late March range
- Our near-term trend bias is higher while 1.0660
- A move through 1.0970 is needed to set off a more important move higher in the exchange rate
- A minor cycle turn window is eyed tomorrow
- A close over below 1.0660 would turn us negative again on the euro
EUR/USD Strategy: Like buying on weakness against 1.0660
| Instrument | Support 2 | Support 1 | Spot | Resistance 1 | Resistance 2 |
|---|---|---|---|---|---|
| EUR/USD | *1.0660 | 1.0805 | 1.0925 | 1.0950 | *1.0970 |
Price & Time Analysis: AUD/USD

Charts Created using Marketscope – Prepared by Kristian Kerr
- AUD/USD broke above the 78.6% retracement of the March-April range to trade at its highes level in over a month today
- Our near-term trend bias is higher in the Aussie while above .7790
- Traction above .7940 is neeeded to trigger a more significant move higher in the rate
- Today looks to be a near-term inflection point
- A daily close below .7790 would turn us negative on AUD./USD
AUD/USD Strategy: Square
| Instrument | Support 2 | Support 1 | Spot | Resistance 1 | Resistance 2 |
|---|---|---|---|---|---|
| AUD/USD | .7790 | .7840 | .7920 | *.7940 | .8015 |
Focus Chart of the Day: USDOLLAR

There has been more troubling price action in the FXCM US Dollar Index over the past few days as the break below 11,915 on Friday technically triggered a head & shoulders topping pattern. A daily settlement below 11,885 would also trigger a multi-week double top. Both patterns suggest this current correction has more room to run. The less ominous interpretation of recent events is that the index is just in the midst of a widening range, but the persistency in the decline over the past couple of weeks is making this look less and less likely. As far as the index components go, USD/JPY could hold the cards as to whether we see these patterns follow through as the rate sits atop the neckline of a pretty clear head & shoulders pattern at 118.40 itself.
To receive Kristian’s analysis directly via email, please SIGN UP HERE.
--- Written by Kristian Kerr, Senior Currency Strategist for DailyFX.com
This publication attempts to further explore the concept that mass movements of human psychology, as represented by the financial markets, are subject to the mathematical laws of nature and through the use of various geometric, arithmetic, statistical and cyclical techniques a better understanding of markets and their corresponding movements can be achieved.
To contact Kristian, e-mail instructor@dailyfx.com. Follow me on Twitter @KKerrFX


