


Talking Points
- USD/JPY advance stalls at minor Fibo
- GBP/USD testing key upside pivot
- USDOLLAR rebuffed by former support
Get real time volume on your charts for free. Click HERE
Foreign Exchange Price & Time at a Glance:
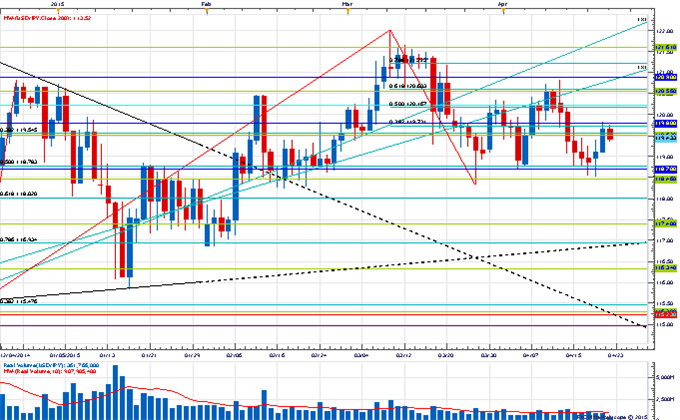
Price & Time Analysis: USD/JPY
Charts Created using Marketscope – Prepared by Kristian Kerr
- USD/JPY bounced from Gann suport around 118.40 at the start of the week
- Our near-term trend bias is lower while below 121.00
- A move under 118.40/20 needed to set off a more important move to the downside in the exchange rate
- A very minor turn window is eyed early next week
- A close over 121.00 would turn us positive on USD/JPY
USD/JPY Strategy: Like the short side while spot remains below 121.00
| Instrument | Support 2 | Support 1 | Spot | Resistance 1 | Resistance 2 |
|---|---|---|---|---|---|
| USD/JPY | *117.40/20 | 19.10 | 119.40 | 119.80 | *121.00 |
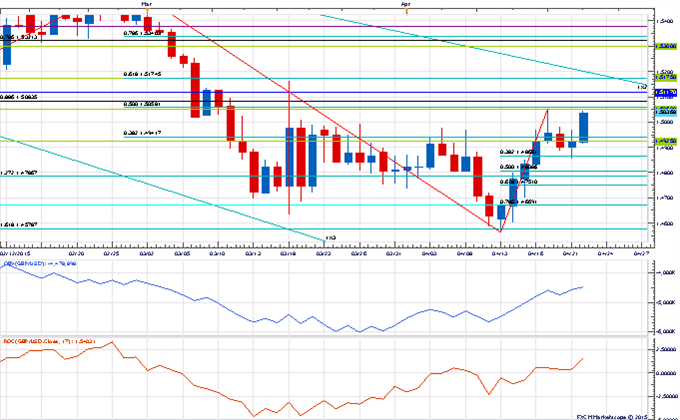
Price & Time Analysis: GBP/USD
Charts Created using Marketscope – Prepared by Kristian Kerr
- GBP/USD rebounded sharply from the 38% retracement of the mid-April range at 1.4865
- Our near-term trend bias is higher in the pound while over 1.4865
- The 50% retracement of the February/April range at 1.5060 is a key pivot with traction above needed to set off a more important leg higher
- A very minor turn window is eyed tomorrow
- A daily close below 1.4865 would turn us negative on Cable
GBP/USD Strategy: Like the long side while over 1.4865.
| Instrument | Support 2 | Support 1 | Spot | Resistance 1 | Resistance 2 |
|---|---|---|---|---|---|
| GBP/USD | *1.4865 | 1.4930 | 1.5030 | *1.5060 | 1.5120 |
Focus Chart of the Day: FXCM US DOLLAR INDEX

The FXCM US Dollar Index looks to be at a near-term inflection point. After recording a new multi-year high last week the index has come under fairly steady pressure. Rally attempts were rebuffed yesterday by the broken internal trendline connecting the December and February lows around 12,040 and follow on weakness in the sessions ahead below 11,925 would signal that a more serious correction against the primary trend is unfolding. Yesterday’s high near 12,045 is now an important near-term cyclical pivot with strength above this level needed to re-focus attention higher.
To receive Kristian’s analysis directly via email, please SIGN UP HERE.
--- Written by Kristian Kerr, Senior Currency Strategist for DailyFX.com
This publication attempts to further explore the concept that mass movements of human psychology, as represented by the financial markets, are subject to the mathematical laws of nature and through the use of various geometric, arithmetic, statistical and cyclical techniques a better understanding of markets and their corresponding movements can be achieved.
To contact Kristian, e-mail instructor@dailyfx.com. Follow me on Twitter @KKerrFX


