


The term ‘Ichimoku,’ literally means ‘one glance,’ in Japanese. Ichimoku is considered to be a self-contained system in the fact that no additional indicators are necessary – everything is included that most traders will need to make trading decisions. How can we use it in our own trading?

One of the most compelling aspects of Technical Analysis is the way that it connects traders around the world.
The fact that I can be trading at my home in Dallas, TX – where I can see, interpret, and act on the same signal that a trader from Shanghai, or Sydney had also identified - plays directly to the self-fulfilling prophecy of Technical Analysis. It’s almost as if it’s a language that, once learned, can whisper sweet potential trade ideas in the trader’s ear.
However – in practice – traders will often learn that the benefits of Technical Analysis aren’t in the ‘secret messages,’ that can exist in markets – but the fact that it can potentially help tilt the odds in our favor – even if just enough – to allow for potential trading profits.
Many traders find a combination of indicators that they feel really strongly about – spend hours upon hours practicing, and manually back-testing (testing the way that the strategy would have worked on charts that had already taken place) the indicators to ensure their efficacy. Even then – principals of trade, risk, and money management are of the upmost importance. Most traders will find that negligence in any of these elements is akin to stuffing your money down a garbage disposal, even if trading with a strong technical strategy.
A system that has recently gained popularity in the United States - and has the ‘pizzazz,’ of being a potential self-fulfilling prophecy while at the same time offering a strong technical infrastructure rooted on sound fundamental trading theory is Ichimoku (pronounced “Each-E-Mo-Ku”).
Ichimoku is a trading system that was originally developed by Japanese journalist Goichi Hosada – as he was looking to develop the ultimate indicator that could provide a multitude of analysis with a very quick glance. The term ‘Ichimoku,’ literally means ‘one glance,’ in Japanese. Ichimoku is considered to be a self-contained system in the fact that no additional indicators are necessary – everything is included that most traders will need to make trading decisions.
Ichimoku is widely traded and followed throughout Japanese trading rooms – lending many to the idea that the unique ways of identifying support and resistance can make the system more acclimating for Yen pairs such as GBP/JPY, EUR/JPY, and USD/JPY.
There are quite a few components of Ichimoku – and it can make a chart look quite busy. In this article, we are going to walk through the core elements of Ichimoku – and how traders are using those parts of the indicator to analyze markets.
Trigger the Base-Line
At the very core of Ichimoku are the Tenkan-Sen and Kijun-Sen lines (referred here-on-out as Tenkan and Kijun respectively.) These two lines are the center of the Ichimoku system – and can be looked at as the ‘trigger,’ that denotes bullishness or bearishness.
Tenkan and Kijun are really just moving averages. They differ slightly from standard moving averages in that they consider the ‘Average price,’ of each candle versus only the closing price (such as a simple or exponential moving average generally will). This causes the line to appear jagged (as opposed to the smoothing effect of a Moving Average calculated on close.)
Tenkan is commonly the first input that the trader will see when applying Ichimoku to a chart. This is a 9 period Moving Average, and we can consider this the ‘Trigger Line,’ of the system – as this is where all of the action behind Ichimoku is taking place. I make this line Lime Green when applying Ichimoku – so that it stands out and is very clear when a crossover takes place.
Kijun is commonly the second input that is used – and this is a 26 period Moving Average (also exponential, calculated on average price). We can consider this as the base line. When the trigger line crosses up and over the base line – this can be considered a bullish signal. When the trigger crosses down, and through the base line – this can be looked at as a bearish signal.
The rest of the indicators within Ichimoku tell us the ‘strength,’ that the signal can be interpreted with.
For right now – it is important to become familiar with the Trigger/Base Line Crossover. If you’re not comfortable with this crossover yet, lets apply it on the chart and manually back-test a few trades to get comfortable with the way that this works.
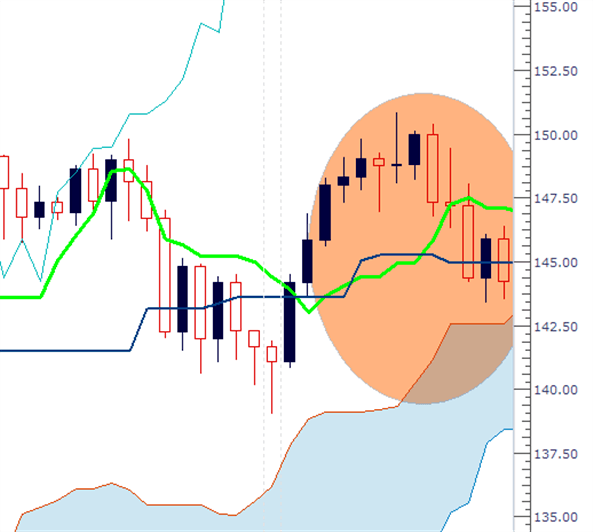
While learning the Trigger/Base Line crossover, it may help to arrange the Ichimoku indicator a easy-to-read manner so that crossover is very clearly printed on the chart. For the remainder of this article, I will be using a ‘Green,’ line for Tenkan, and a ‘Blue,’ line for Kijun.
Once completed, our charts should look roughly similar to what you see below:

Now that we have Ichimoku completely applied to our charts – we can look at the power that the Trigger Line/Base Line crossover has.
For right now – let’s ignore everything on the chart other than the Trigger and the Base Line.
Now that we are back in time – we can begin testing the Trigger Line/Base Line crossover. We can do this by simply clicking on the ‘Forward-Arrow,’ on our keyboards. This will cause Marketscope to go forward one candle at a time on the chart. We can keep going forward until we see a Trigger Line/Base Line Crossover. Each time a crossover takes place – make note (either by writing down, or just noting mentally) and go further forward in time – watching how a hypothetical trade would have played out.
For example – notice on the below chart that we have a Bullish Crossover taking place on 5/11/2009 on GBP/JPY. I’ve highlighted the portion of the chart in which the Trigger Line is crossing over the Base Line – indicating the bullishness that may be entering into the pair.
We can then go forward in time by clicking on the ‘Forward-Arrow,’ of the keyboard – watching the way that this hypothetical BUY position would have worked out.
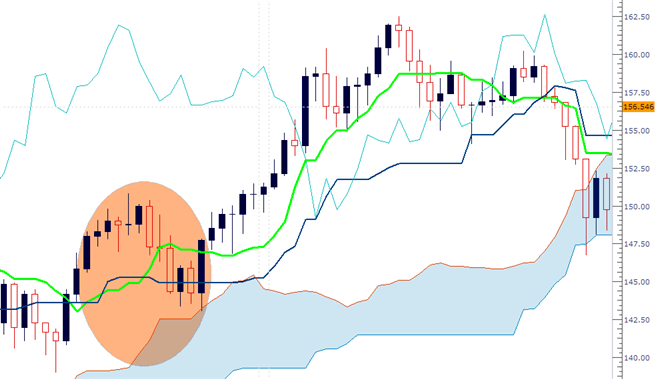
After testing the way that this BUY entry would have worked – we see that the Bullish crossover of the Trigger Line over the Base Line immediately preceeded a 1,000+ pip run on the GBP/JPY currency pair.
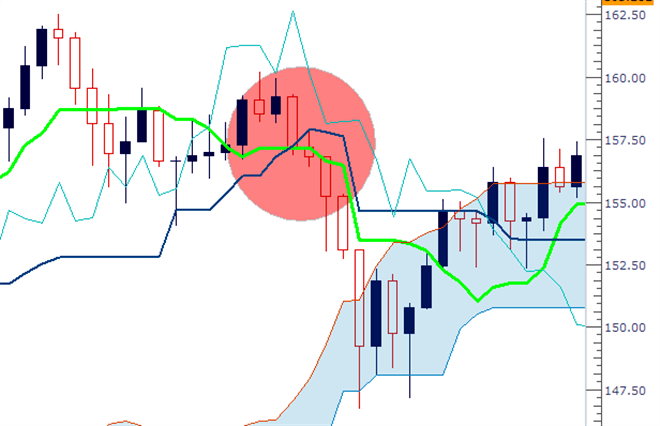
We can then move onto the next crossover – which if you look at the chart above – will notice that the bearish crossover (Trigger Line fell down, and through the Base Line) took place shortly after the high around 162.50 was hit. We can now chart this SELL entry to see the way that it would have hypothetically worked out for us.
In the chart below – I’ve highlighted this SELL entry as the Trigger Line has crossed down and through the Base Line. Notice that this entry would not have been as profitable as the previous bullish entry that we had taken – but after the signal took place – GBP/JPY went down over 700 pips.
The goal of manually back-testing these entries is so that we can internalize what happens when the Trigger Line crosses the Base Line.
These are two of the most important elements of Ichimoku – and are the very core of the system. Everything else in Ichimoku helps us interpret these BUY and SELL signals – indicating how strong they may have been. In future articles – we will discuss these elements and how they can help us interpret the Trigger Line/Base Line crossover.
Manually back-test until you feel comfortable with the Trigger Line/Base Line crossover, and comfort with this signal is of the upmost importance when trading Ichimoku. If you have a difficult time remembering which line is which, try to think of it as “Tenkan = Trigger, and Base Line = Blue.”
Next: Trading in the Clouds - The Art of Ichimoku, Part 2 (45 of 50)
Previous: Can Trading Be As Easy As ABCD?
In next week’s article – we will talk about the most popular part of Ichimoku: “The Cloud.” If you would like to be notified once next week’s article is available, please email me at Instructor@DailyFX.com.


