


USD/MXN, USD/KRW, USD/BRL, USD/THB Technical Analysis – Talking Points:
- USD/MXN on the verge of a rebound? Consolidation may spring pair into action
- USD/BRL frustratingly range-bound since March 2020 spike - when will it end?
- USD/KRW, USD/THB both approaching key inflection points - volatility ahead?
Introduction to Technical Analysis
Learn Technical Analysis
Recommended by Dimitri Zabelin
USD/MXN ANALYSIS
USD/MXN has been trading sideways since early September after cascading from the multi-week highs of the 20.4578-20.3490 peak (gold-dotted lines). The pair appears to be in the process of consolidating following selling exhaustion. Buyers looking for a discount may now swoop in and catalyze a rebound, potentially taking the pair to retest familiar heights.
USD/MXN - Daily Chart
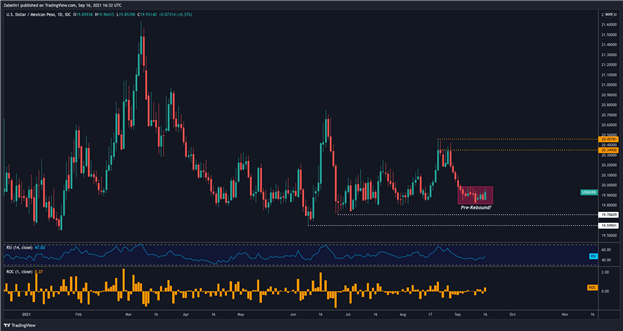
Source: TradingView
Furthermore, the RSI reading close to the 40-level – sometimes viewed as a threshold for being in “oversold” territory – is also supportive of the notion of a rebound. Having said that, a lack of upside conviction could cause USD/MXN to retest two layers of support. The first trial would be at 19.7060, with a second tier at 19.5990 (white-dotted lines).
A weekly chart more clearly illustrates the consolidative nature of USD/MXN following the dramatic rise in March of 2020 and the subsequent decline that has been underway since. The broader time horizon supports the micro picture of consolidation, suggesting perhaps an underlying indecision in traders’ outlooks.
USD/MXN - Weekly Chart
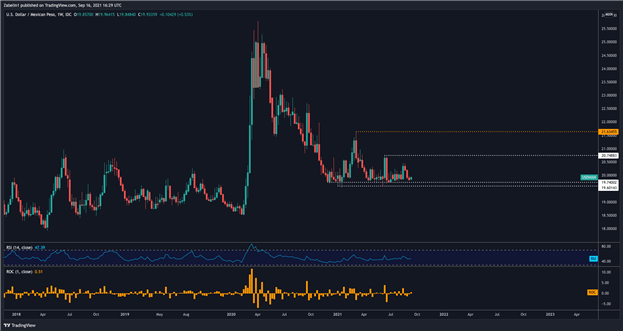
Source: TradingView
A bullish view would postulate that the pair may test the previous, near-term high at 20.7488 before embarking on a more ambitious goal of piercing the multi-month swing-high at 21.6345. Looking ahead, monitoring how USD/MXN interacts at these key levels may be crucial in helping discern the underlying outlook for the pair’s trajectory.
USD/KRW OUTLOOK
Since early June, the US Dollar has risen a little over 6 percent against the South Korean Won. The pair appears to be climbing a steady, and frequently-tested rising support channel. USD/KRW traded briefly in a so-called compression zone marked by the upward slope and the prior swing high at 1184.16.
USD/KRW - Daily Chart
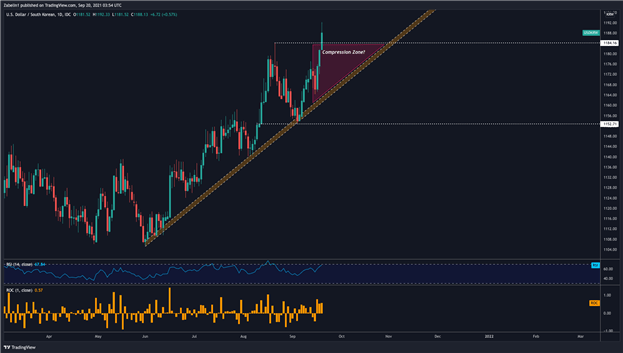
Source: TradingView
During early Asia trade, USD/KRW gapped sharply higher and breached the upper threshold. The bulls appeared to have broken out of the pen, and this breakthrough could mark the acceleration of the prior ascension. Having said that, RSI is alarmingly close to the 70-marker which is generally acknowledged as being in “overbought” territory.
Zooming out on a weekly basis provides a clearer picture. After bottoming out in a multi-year low in early 2021, the pair subsequently rose before undergoing a minor correction in April/May. Following the descent, the US Dollar steadily rose over 5% vs the South Korean Won, but that underlying strength is now going to be tested.
USD/KRW - Weekly Chart
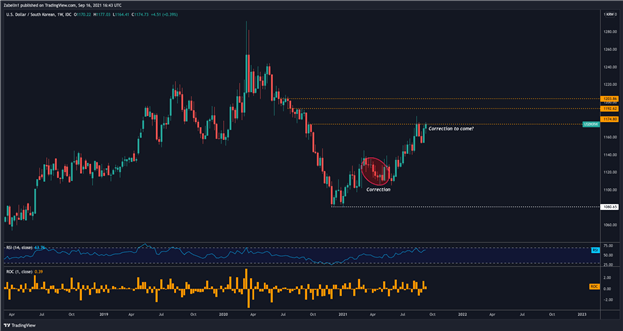
Source: TradingView
The pair is encountering some friction as it tries to break what appears to be resilient resistance at 1174.80. If the ceiling remains stubborn, USD/KRW may capitulate and subsequently cool down. A period of consolidation will likely then follow where traders will assess whether further bullish development is tenable.
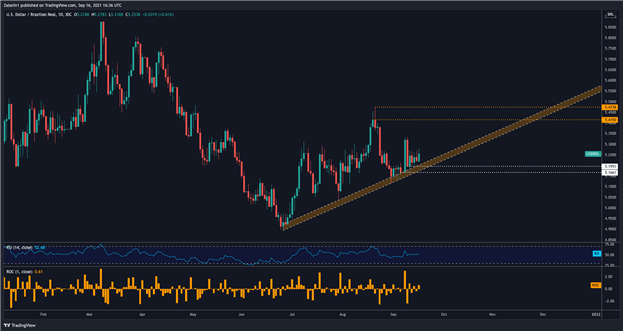
USD/BRL FORECAST
USD/BRL has been travelling along a modest uptrend originating in early-July following an over-15 percent decline from the peak in March. The pair’s next obstacle to clear may be the prior close at 5.4150, and beyond that the multi-month peak at 5.4738 (gold-dotted lines). Clearing those areas may amplify what will already be an established underlying bullish outlook.
USD/BRL - Daily Chart
Source: TradingView
However, if US Dollar strength runs out of steam – or the Brazilian Real strengthens comparatively more than the Greenback – then the prior uptrend may be in danger. Shattering upward-sloping support could expose USD/BRL to retest the support range between 5.1951-5.1661 (white-dotted lines).
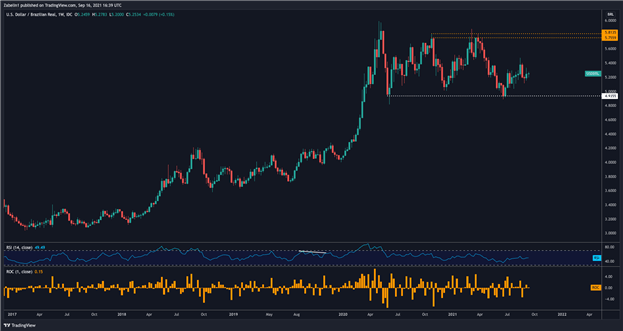
Looking through a wider lens shows the limits of the analysis of a daily chart. While a bullish spike may ensue if the aforementioned resistance layers are cleared, it will take a lot more to break the multi-month, range-bound nature of USD/BRL. The pair only recently bounced back from support at 4.9355, and already it is showing signs of plateauing.
USD/BRL - Weekly Chart
Source: TradingView
Looking ahead, a decisive break from either the top or bottom ranges will provide a clear enough signal that a major secular trend has been broken. Resistance between the 5.7559-5.8135 range has held steady in October 2020 and Q2 2021. An unsuccessful retest of the multi-layered ceiling may reinforce a bearish outlook and speak to a broader underlying lack of confidence.
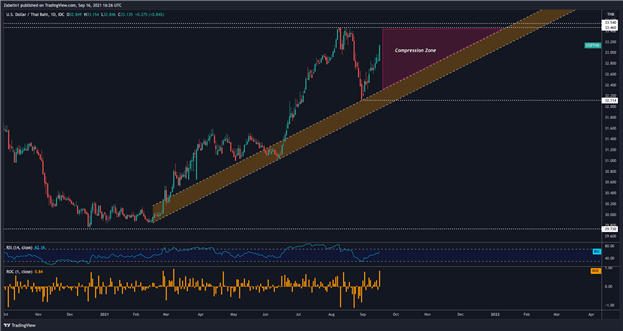
USD/THB PROJECTION
Since mid-February, the US Dollar has had a leg up on the Thai Baht and has risen over 10 percent in the past seven months. The pair briefly touched the lower lip of the 33.540-33.460 3-year high range back in late-July before capitulating and retesting ascending support. The pair’s almost-immediate bounce strongly supports the notion of an underlying bullish bias.
USD/THB - Daily Chart
Source: TradingView
Like with USD/KRW, USD/THB may also be in the adolescent stages of entering a compression zone, though with arguably higher stakes given the technical circumstances. As such, the possibility of intensified volatility is also comparatively higher. Consecutive rejections of the resistance range could discourage bulls and subsequently have the bears come out of their caves.
In such an event, USD/THB would break the uptrend, and the significance of the ascending support’s end could further entrench bearish sentiment. A key point of friction amid a selloff may be the rebound point at 32.114. Cracking that floor would further amplify losses, though this could be buffered if the number of eager buyers outbid the number of disillusioned sellers.
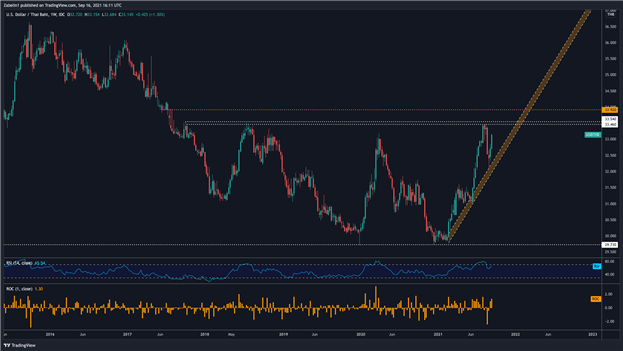
USD/THB - Weekly Chart
Source: TradingView
A weekly chart reinforces this thesis and underscores the technical significance of the 33.540-33.460 range as well as the steep nature of the pair’s rise. The sharp ascent would then almost certainly correct in a similar magnitude - easy come, easy go. Looking ahead, traders should operate with particular prudence given the potentially volatile circumstances.
For additional insights, be sure to follow me on Twitter @ZabelinDimitri !
Trade Smarter - Sign up for the DailyFX Newsletter
Receive timely and compelling market commentary from the DailyFX team


