


AUD/CHF, NZD/CHF, CAD/CHF TECHNICAL ANALYSIS – TALKING POINTS
- The Swiss Franc has come back from a low against AUD and NZD in February
- Recent AUD/CHF and NZD/CHF moves are yet to define a trend change
- CAD/CHF has a penchant for range trading – will this continue?
Introduction to Technical Analysis
Learn Technical Analysis
Recommended by Daniel McCarthy
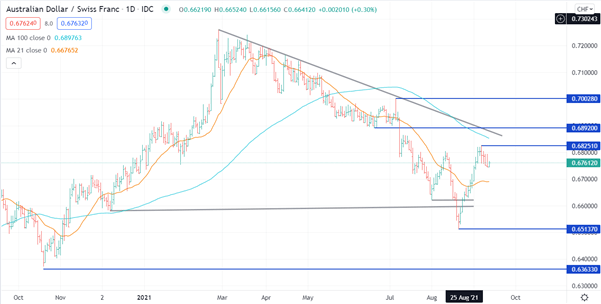
AUD/CHF Technical Analysis
Since making a high in February, AUD/CHF has been in a down trend, making lower highs and lower lows. The move lower accelerated in early July and made the low at 0.6513 in late August. In doing so, the cross broke down through two support levels from previous bottoms. The cross then rallied sharply back up through those breakdown pivot points, which suggests the market rejected that bearish move for now.
To break the down trend, there are number of resistance levels that will need to be overcome. Immediately above the market is the most recent high at 0.6825. The descending trend line currently comes in at 0.6880 and the 100-day simple moving average (SMA) is presently at 0.6853. Above that, there is a reverse pivot point at 0.6892 and a previous high at 0.7003 that may offer resistance.
On the downside, the 21-day SMA at 0.6690 may provide some support and the two previous lows of 0.6514 and 0.6363 might also provide some support if those levels were to be tested.
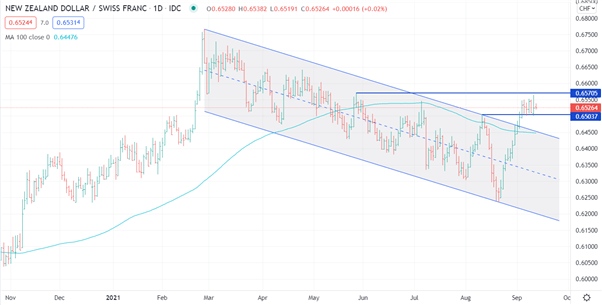
NZD/CHF Technical Analysis
NZD/CHF has a similar set-up to AUD/CHF, except that the former’s rally of late has taken out a few more topside resistance levels. The recent run higher has seen NZD/CHF break through the top of the descending trading channel. It is trading above the 100-day SMA at 0.6521 and that level may provide some support, followed by recent lows near 0.6500. On the topside, the May high at 0.6570 might offer some resistance.
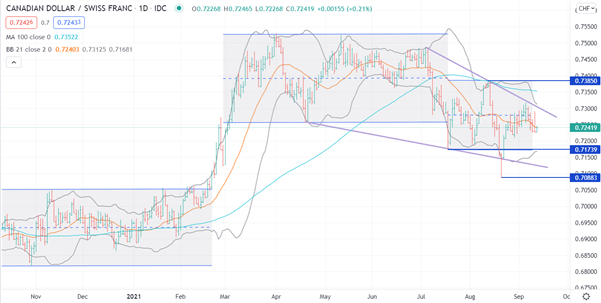
CAD/CHF Technical Analysis
The CAD/CHF cross rate has recently spent periods within various trading ranges, and it might be the case that it has established a new one after having broken lower in August. The move back up from that low was fast and it is now trading within a broad range again.
A range-trading envelope is currently showing potential resistance at a recent high of 0.7385 and at the 100-day SMA at 0.7352. Support may be provided at the reverse pivot point at 0.7174 or the previous low at 0.7088.
The 21-day SMA, 2 standard deviation Bolling Bands are illustrating that the CAD/CHF is in the middle of recent price action. If a break-out of the range was to occur, there is an underlying bias toward a down trend in place. Trend line barriers may offer resistance at 0.7305 and initial support at 0.7125.
--- Written by Daniel McCarthy, Strategist for DailyFX.com
To contact Daniel, use the comments section below or @DanMcCathyFX on Twitter
Trade Smarter - Sign up for the DailyFX Newsletter
Receive timely and compelling market commentary from the DailyFX team


