


British Pound vs New Zealand Technical Forecast
- GBP/NZD rebounded from a multi-month low, what’s next?
- GBP vs NZD bearish momentum is still in place
GBP/NZD – Bears Remain in Charge
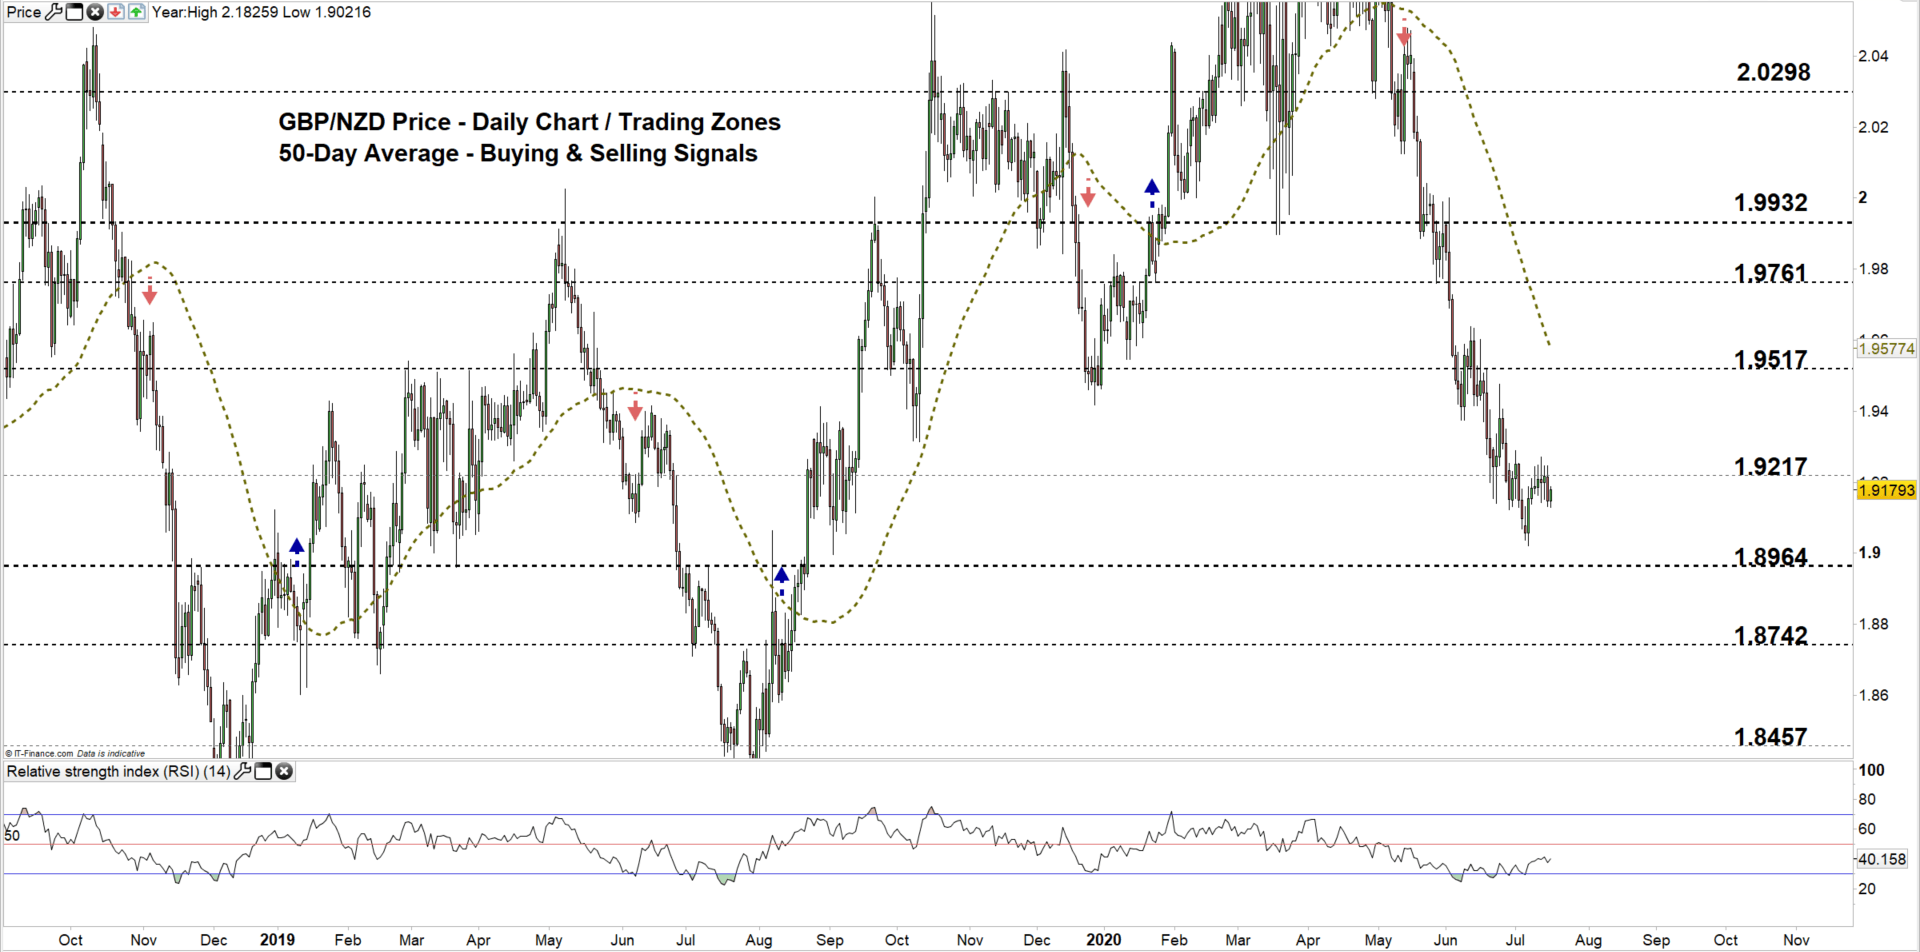
Last week, GBP/NZD hit an over ten-month low of 1.9021 then rallied after as some bears seemed to cover. Ultimately, the pair closed a weekly candlestick modestly in the green with a 0.5% gain. Alongside that, the Relative Strength Index (RSI) rose from 30 to 40 and reflected a weaker bearish momentum.
Last week, the British pound recovered some ground against the New-Zealand dollar due to the UK government plan to revive the UK economy. Nonetheless, the uncertainty of the EU/UK talks kept the lid on any further positive move of the pair.
GBP/NZD Daily PRice CHART (July 20, 2018 – JuLy 16, 2020) Zoomed Out

GBP/NZD Daily PRice CHART (March 10 – JuLy 16, 2020) Zoomed In
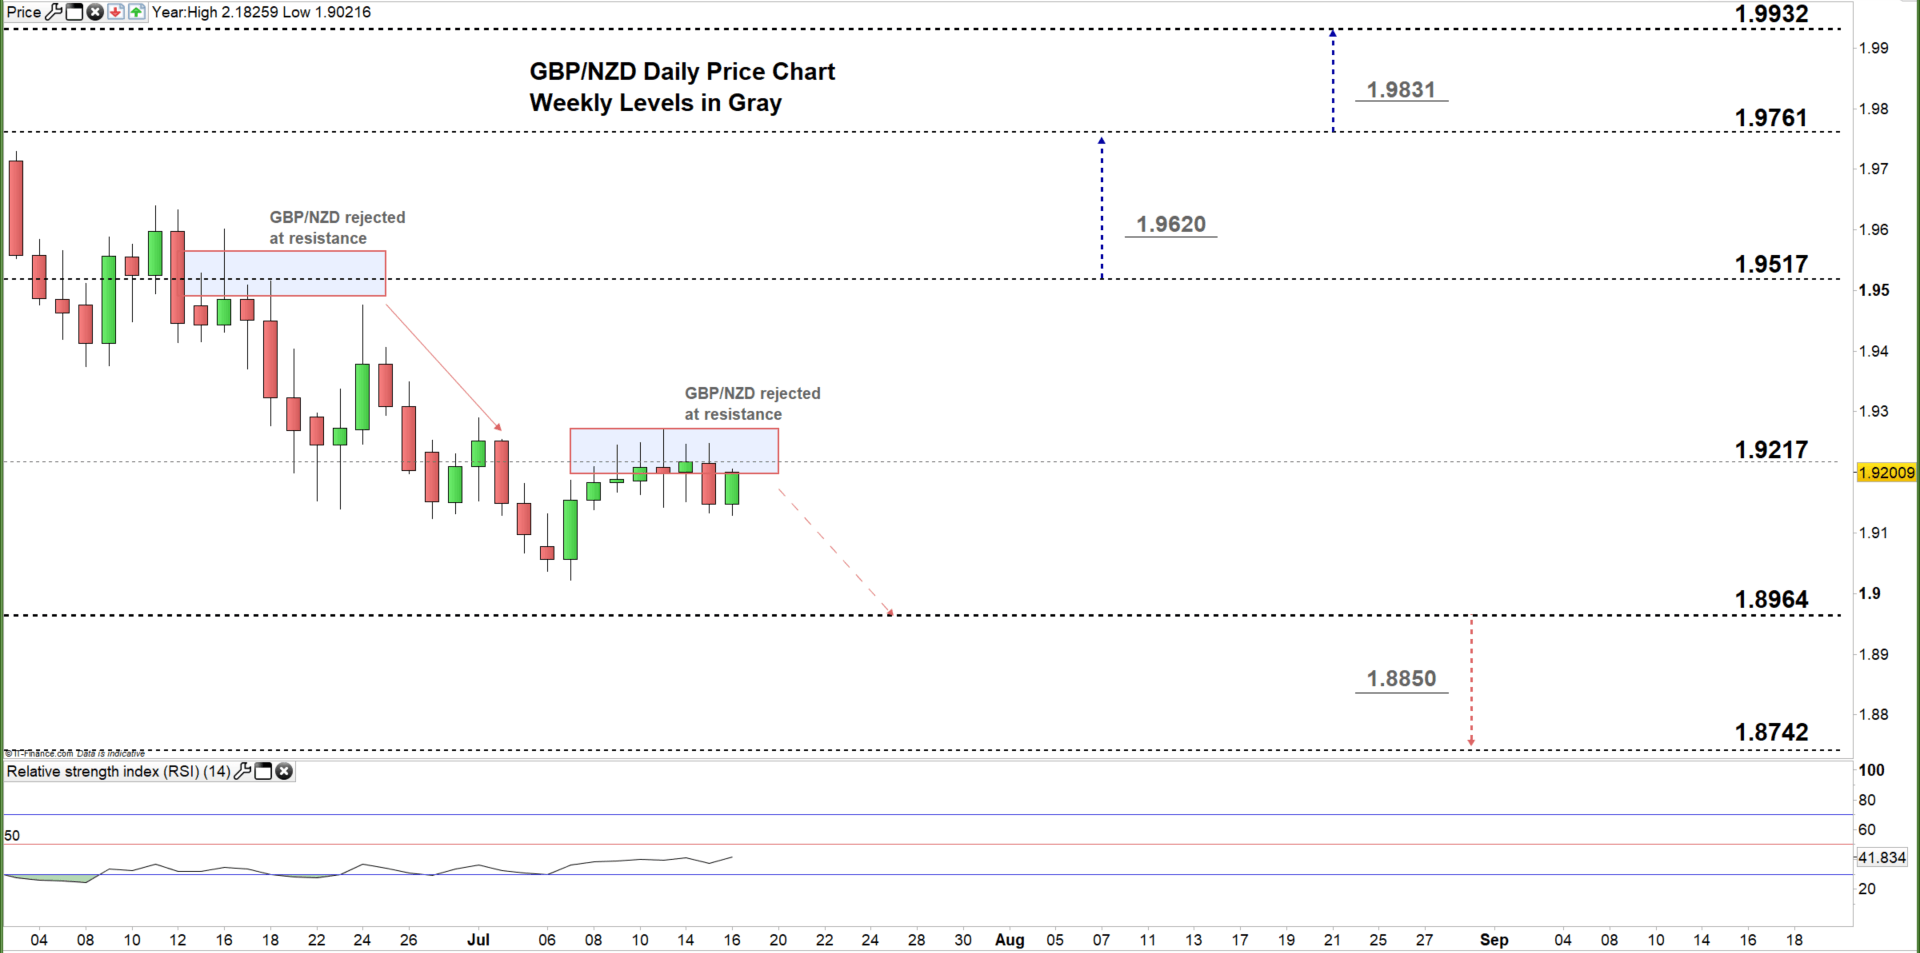
On July 7, GBP/NZD pulled up from a multi-month slide and rallied to the high end of the current trading zone 1.8964 – 1.9217. Since then, the price has failed on multiple occasions to break through to the higher trading zone, repeatedly rebuffing efforts to put bulls in charge.
Another close below the high end of the zone may ultimately guide GBPNZD’s fall towards the low end of the zone, and any further close below that level could encourage bears to press towards 1.8742- a monthly support level.
On the flip-side, a close above the high end of the zone may cause a push behind GBP/NZD towards 1.9517 and a further close above that could extend the rally towards 1.9761.

GBP/NZD Four Hour PRice CHART (April 22 – JuLy 16, 2020)
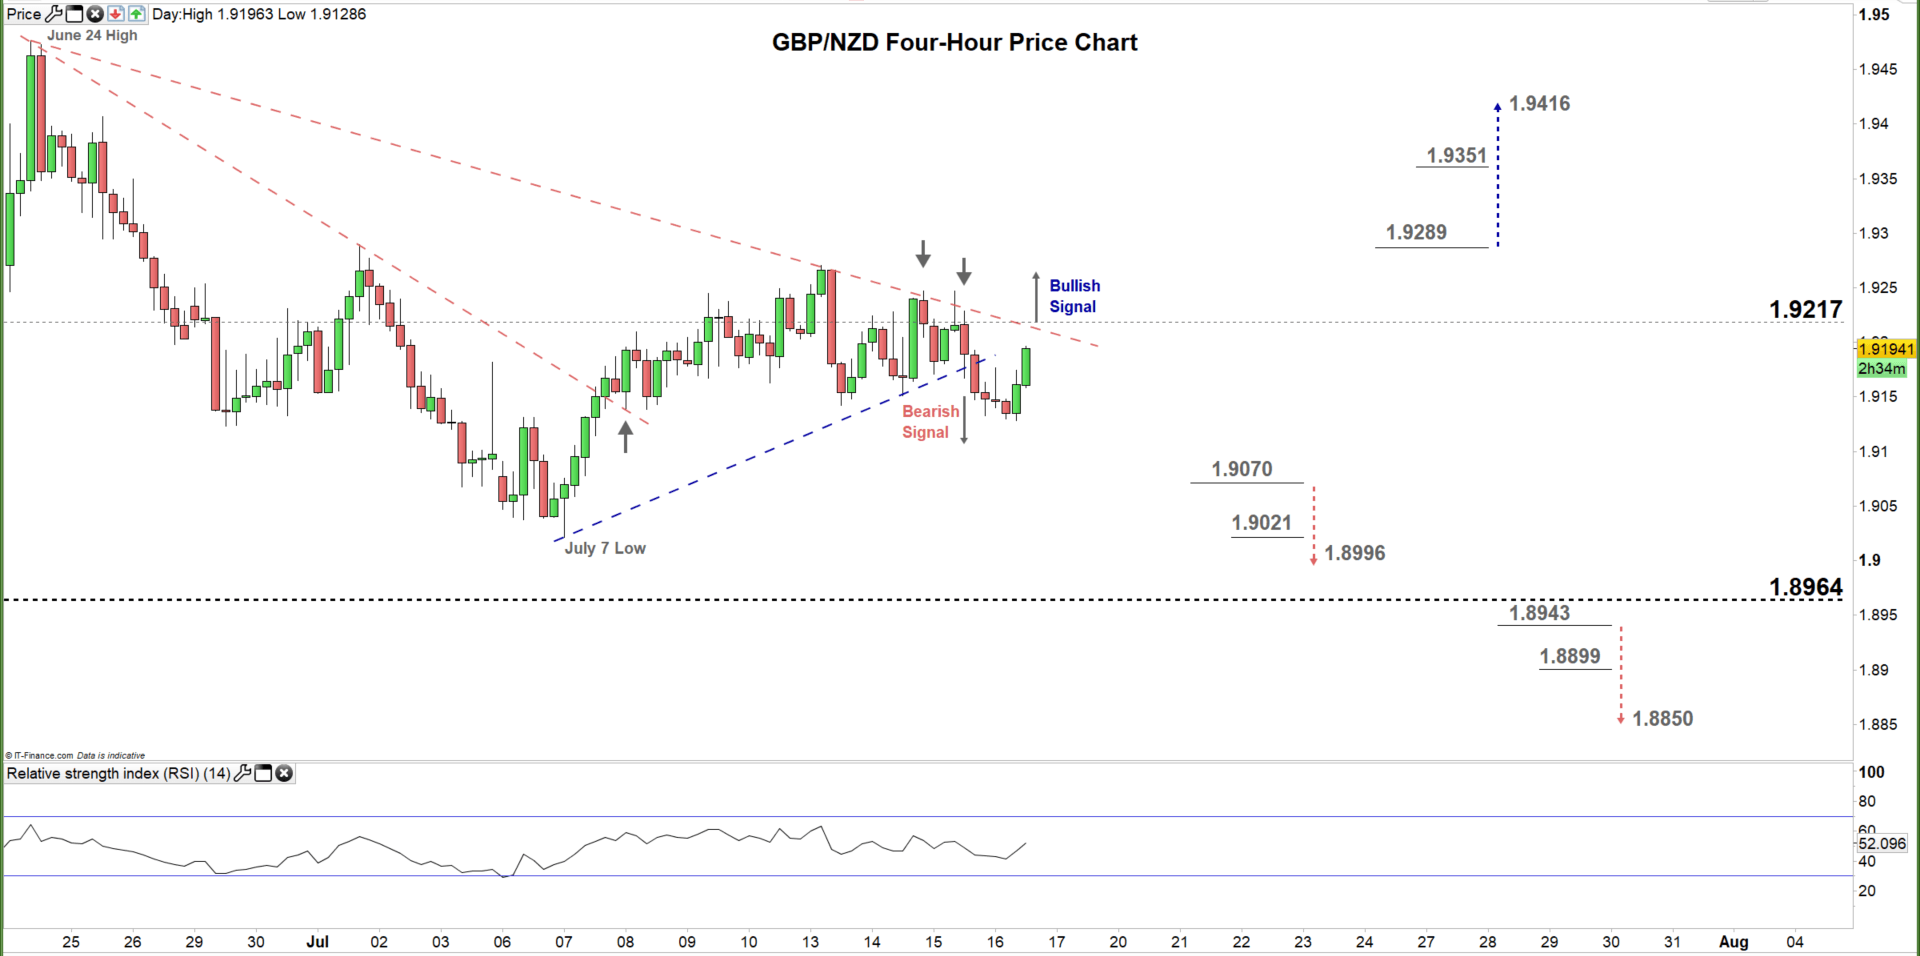
On July 7, GBP/NZD traded above the first downward sloping trend line resistance originating with the June 24 high at 1.9476, indicating a shift in favor of the bull’s to control.
In another short term technical shift, the pair broke yesterday below the bullish trendline support originating with the July 7 low at 1.9021 which in turn has kept bearish potential alive.
Thus, a break above the July 1 high at 1.9282 could trigger a rally towards 1.9416, while any break below 1.9070 may send GBPNZD towards 1.8996. As such, the weekly support and resistance levels underlined on the four-hour chart should be kept in focus.

Written By: Mahmoud Alkudsi,Market analyst
Please feel free to contact me on Twitter: @Malkudsi


