


British Pound vs Swiss Franc Technical Forecast
GBP/CHF- Bears Pullback
On June 29, GBP/CHF declined to a near three-month low at 1.1631. However, the price reversed higher during the week then closed the weekly candlestick in the green with a 0.9% gain.
Alongside that, the Relative Strength Index rose from 36 to 46 highlighting a weaker bearish momentum.
GBP/CHF Daily PRice CHART (July 20, 2018 – JULY 9, 2020) Zoomed Out


GBP/CHF Daily PRice CHART (March 10 – July 9, 2020) Zoomed In
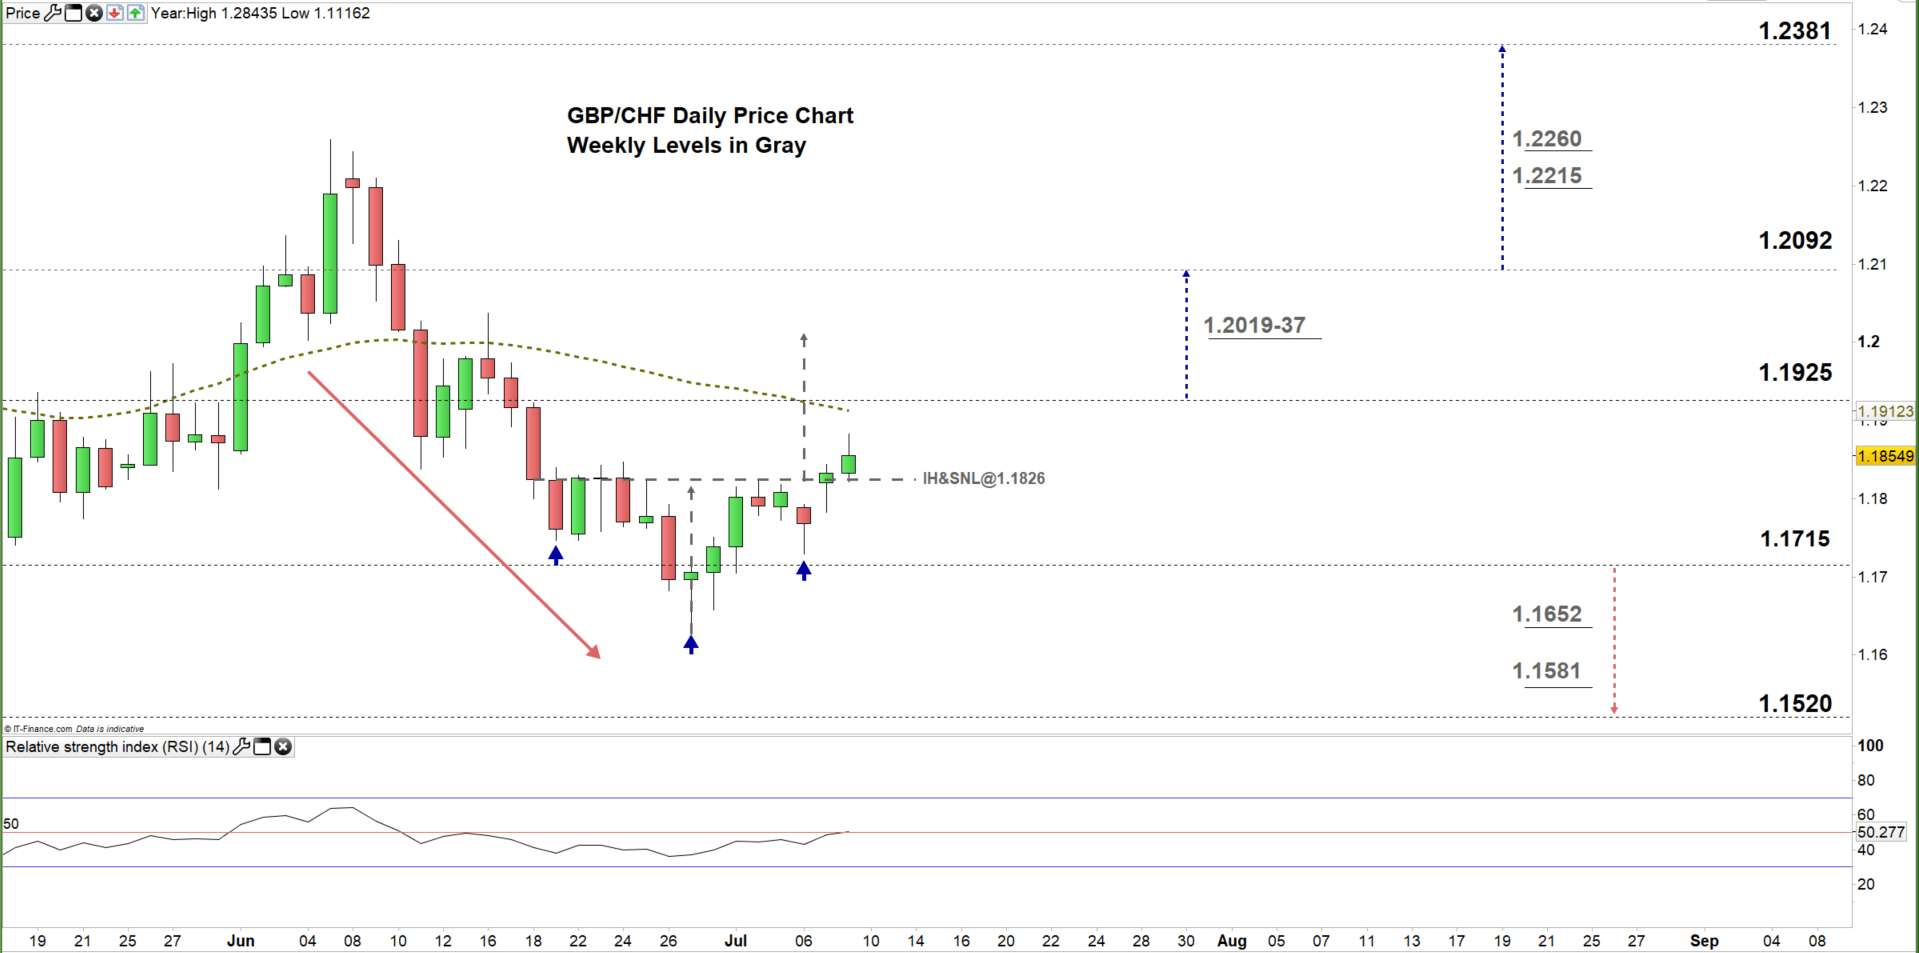
At the start of July, GBP/CHF climbed back to the current trading zone 1.1715 – 1.1925 and signaled bear’s hesitation at that point. Yesterday, the price broke above the neckline of an inverted head and shoulders pattern residing at 1.1826 indicating that the market could point even higher while above the neckline.
A close above the high end of the current trading zone signals that bulls could push GBPCHF towards 1.2092 and any further close above that level may encourage them to extend the rally towards 1.2381.
On the other hand, any failure in closing above the high end of the zone reflects bull’s hesitation and this could send the pair towards the low end of the zone. A further close below that level could send the price even lower towards 1.1520.

GBP/CHF Four Hour PRice CHART (June 10 – July 9, 2020)
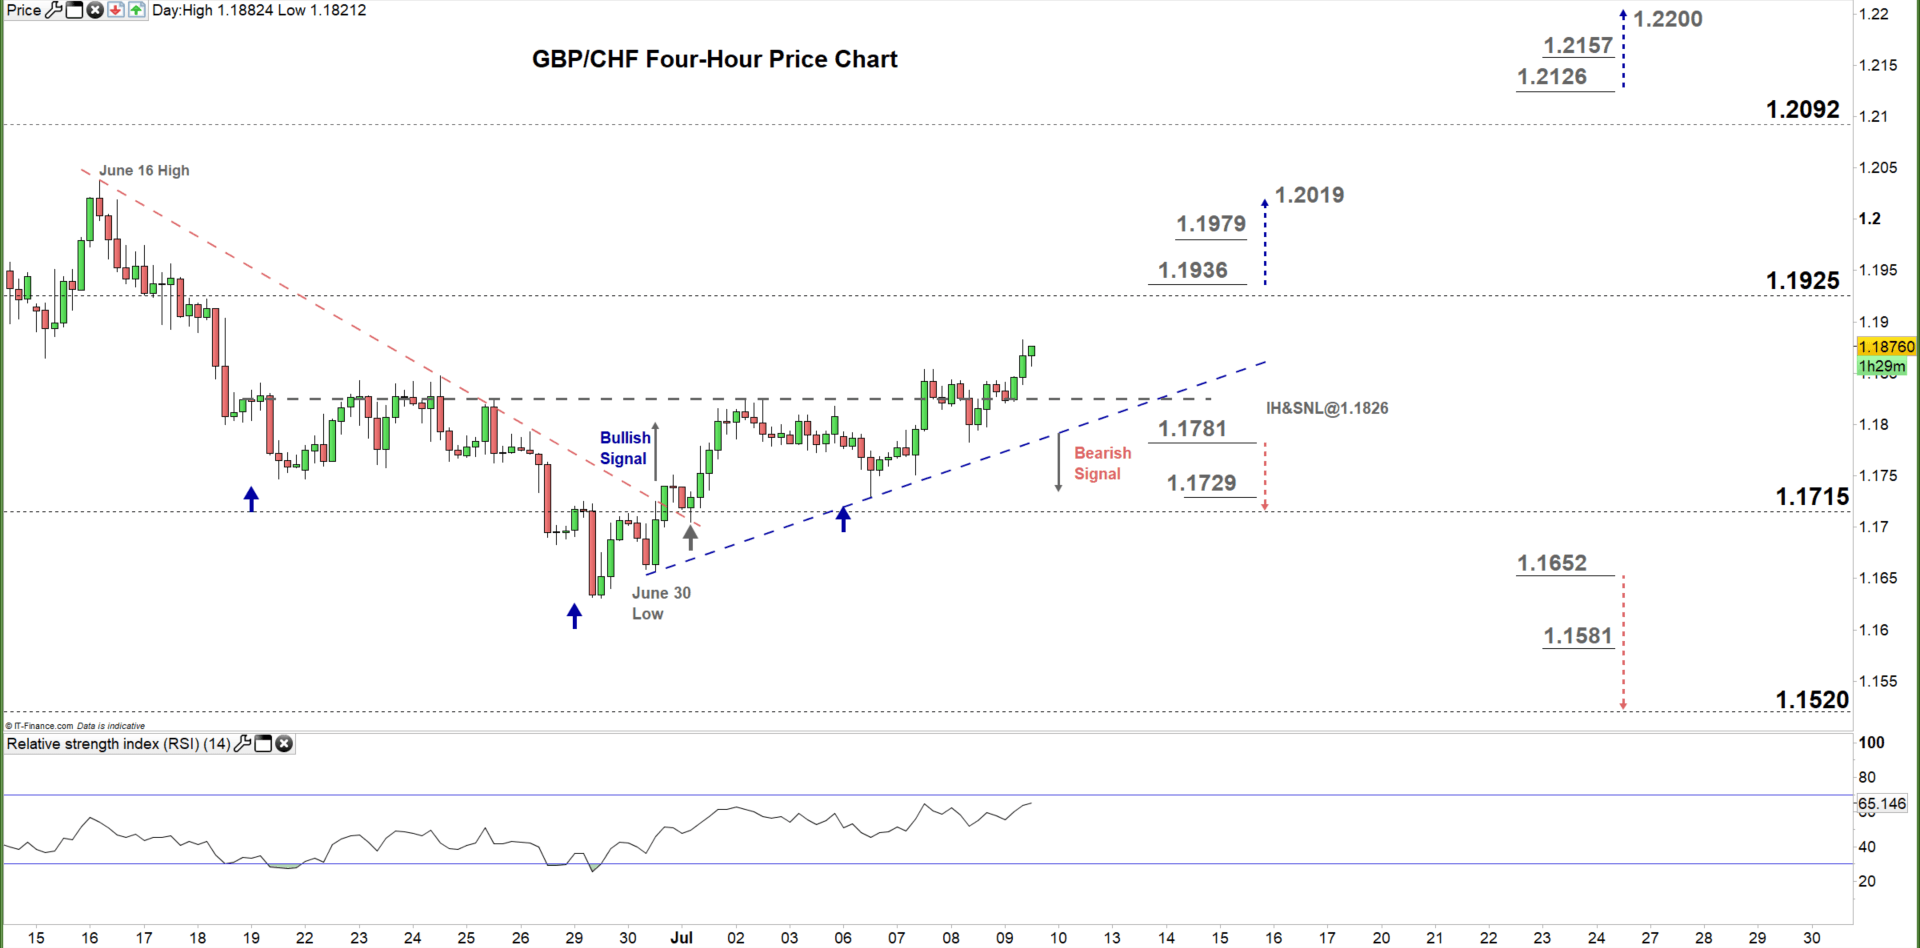
In late June/early July, GBP/CHF broke and remained above the downtrend line and generated a bullish signal. Today, the price has continued bullish price action and made a fresh three-week high at 1.1882. That said, a break below the uptrend line originated from the June 30 low at 1.1657 would generate a bearish signal.
To conclude, a break above 1.1936 could trigger a rally towards 1.2019, while a break below 1.1781 may send GBPCHF towards the low end of the current trading zone discussed above on the daily chart. Nevertheless, the daily support and resistance levels marked on the chart should be considered.
Written By: Mahmoud Alkudsi,Market analyst
Please feel free to contact me on Twitter: @Malkudsi


