


AUD Analysis and Talking Points
- AUD/USD | Upside Limited in Absence of US-China Trade Deal
- AUD/NZD | Diverging Monetary Policy Sparks Further Losses
AUD/USD | Upside Limited in Absence of US-China Trade Deal
Despite growing signals that the Australian economy is slowing down, external factors and in particular, US-China trade war sentiment has kept AUD/USD afloat with the pair maintaining a foothold above 0.6800. That said, in the absence of an official phase 1 agreement between the US and China, upside in the pair looks to be somewhat limited. Near-term resistance is situated at 0.6870 (23.6% fib) while the descending trendline from the Dec’18 peak is likely to cap AUD/USD.
Implied weekly range (0.6785 – 0.6910)
| Support | Resistance | ||
|---|---|---|---|
| 0.6830 | 38.2% Fib | 0.6870 | 23.6% Fib |
| 0.6810 | 50-100DMA | 1.3345 | Trendline Resistance |
| 0.6800 | - | 0.6930 | October Peak |
AUD/USD Price Chart: Daily Time Frame (Aug 2019 –Dec 2019)
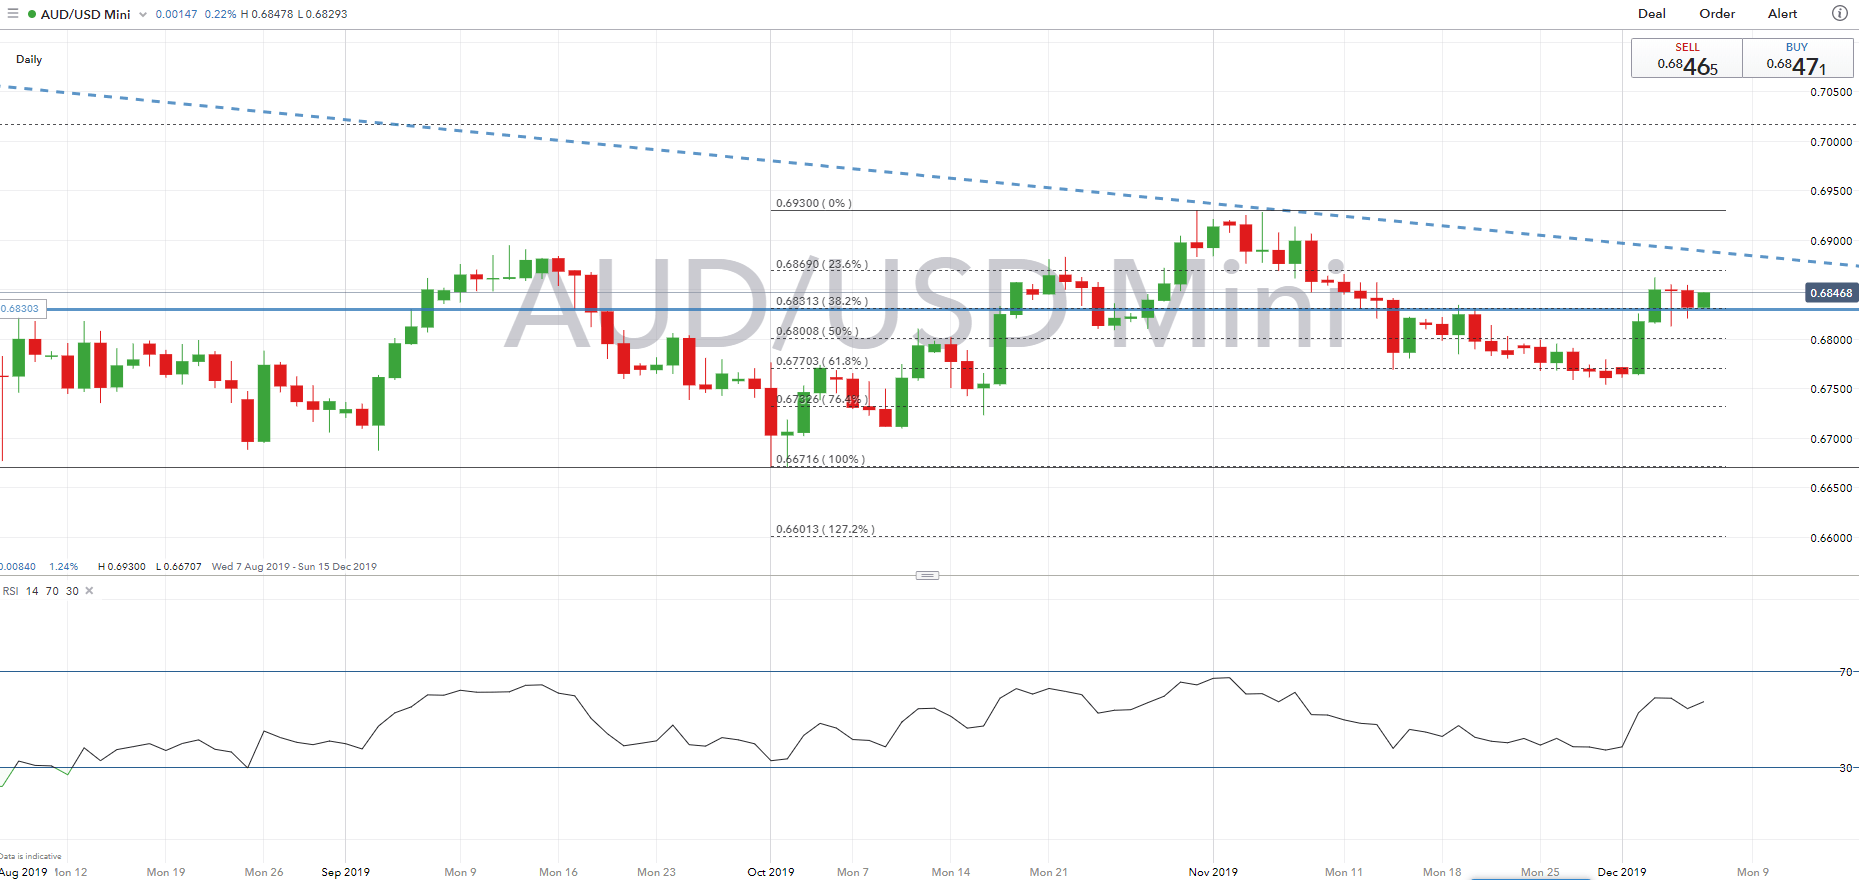
Source: IG
AUD/NZD | Diverging Monetary Policy Sparks Further Losses
Selling in AUD/NZD has shown little signs of easing up with cross marking a 4th consecutive weekly loss for the first time since March. Overnight, the RBNZ Deputy Governor Bascand, had echoed similar comments made by Governor Orr, that the economy at a turning point and thus the outlook with regard to monetary policy is balanced. In contrast, the RBA look increasingly likely that they will be forced to ease further amid the continued deterioration in the Australian economy and thus the monetary policy divergence has placed pressure on AUD/NZD, while the stretched short positioning in the Kiwi relative to the Aussie also favours a lower cross.
On the technical front, while the outlook remains bearish, the positive DMI indicator is at somewhat excessive, which coincides with a notably elevated trend indicator and thus downside in the cross may begin to ease off around 1.0400. Failure to do so however, brings the trendline from the all-time low into focus at 1.0280, which we expect would become attractive to dip buyers on a risk-reward basis.
AUD/NZD Price Chart: Daily Time Frame (Jul 2018 – Dec 2019)
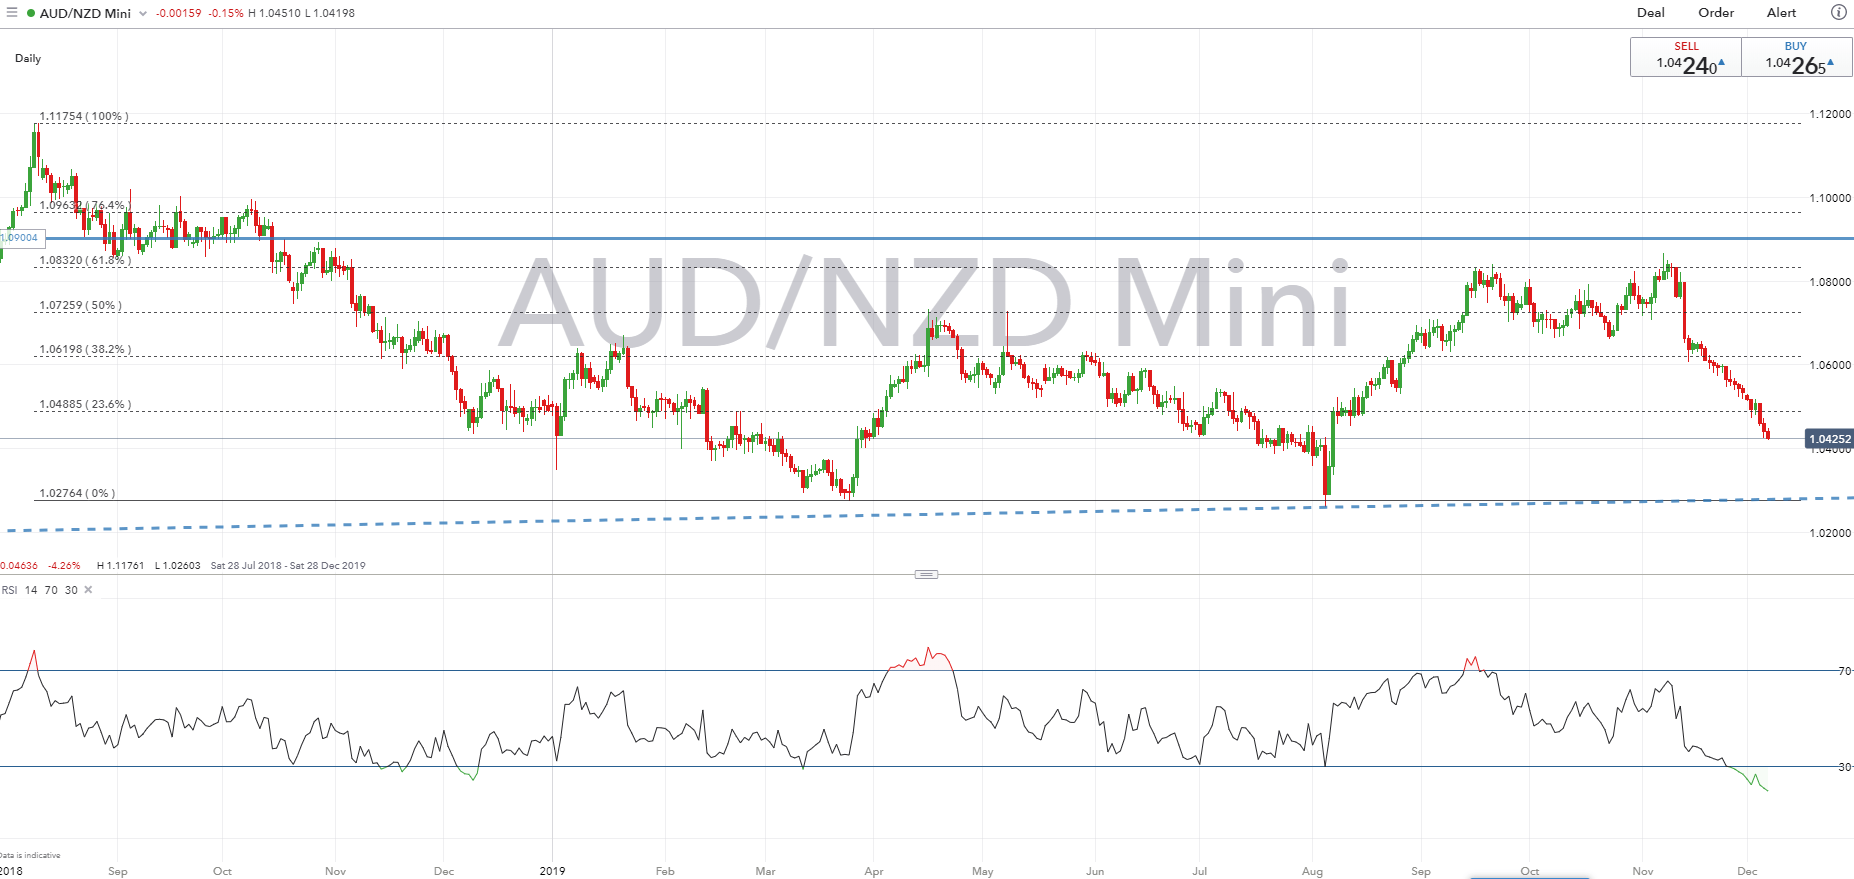
Source: IG
AUD/NZD DMI and ADX Indicators: Daily Timeframe (Dec 2017 – Dec 2019)
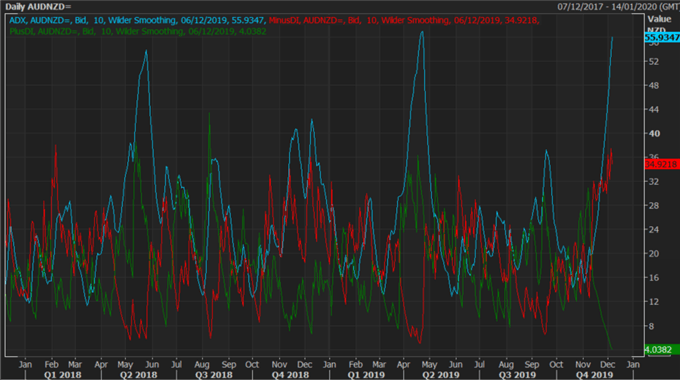
Source: Refinitiv
--- Written by Justin McQueen, Market Analyst
To contact Justin, email him at Justin.mcqueen@ig.com
Follow Justin on Twitter @JMcQueenFX


