


CAD Analysis and Talking Points
USD/CAD | Bullish Momentum Intact
Since the Bank of Canada’s dovish pivot at the October MPR, USD/CAD has shown little signs of reversing its bullish momentum. Yesterday saw the Canadian Dollar come under renewed pressure as oil prices dropped, while the Loonie extended its losses on comments by BoC Deputy Wilkins, in which she noted that with rates at 1.75%, the central bank has room to manoeuvre. Consequently, the USD/CAD has made a decisive break above its 200DMA and thus the bullish trend remains intact. As such, with eyes on the Canadian CPI data, a lower than expected reading could see the pair edge towards the October 3rd/10th double top at 1.3345, while the September high resides at 1.3382.
Implied Daily Range (1.3255-1.3335)
| Support | Resistance | ||
|---|---|---|---|
| 1.3274 | 200DMA | 1.3300 | Trendline |
| 1.3212 | 50DMA | 1.3345 | October Double Top |
| 1.3203 | 100DMA | 1.3355 | 61.8% Fib |
USD/CAD Price Chart: Daily Time Frame (Apr 2019 – Nov 2019)
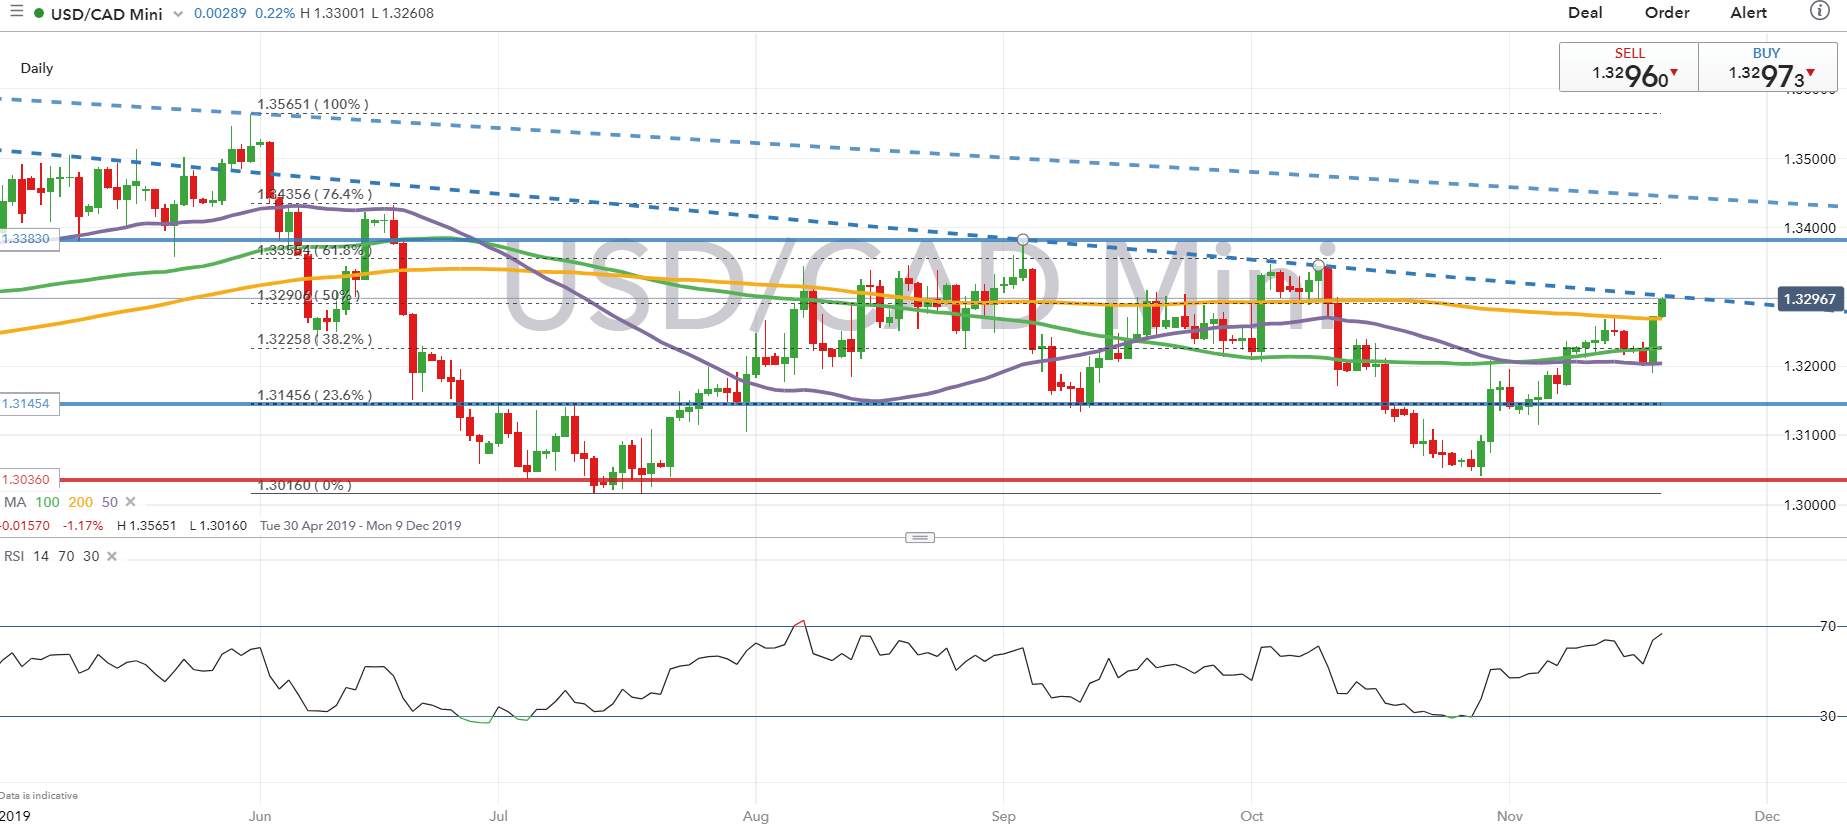
Source: IG Charts
USD/CAD DMIs and ADX (Jun 2019 – Nov 2019)
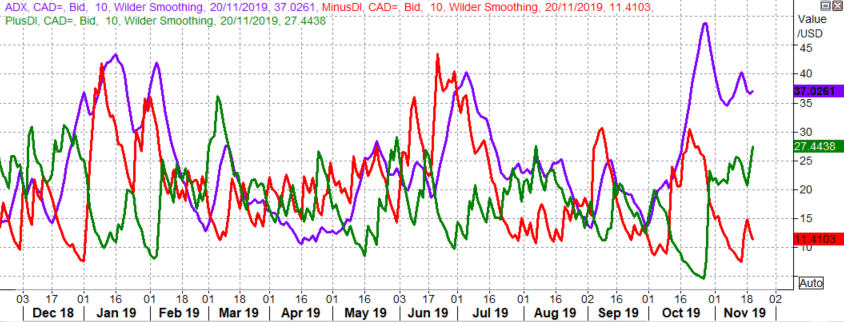
Source: Refinitiv
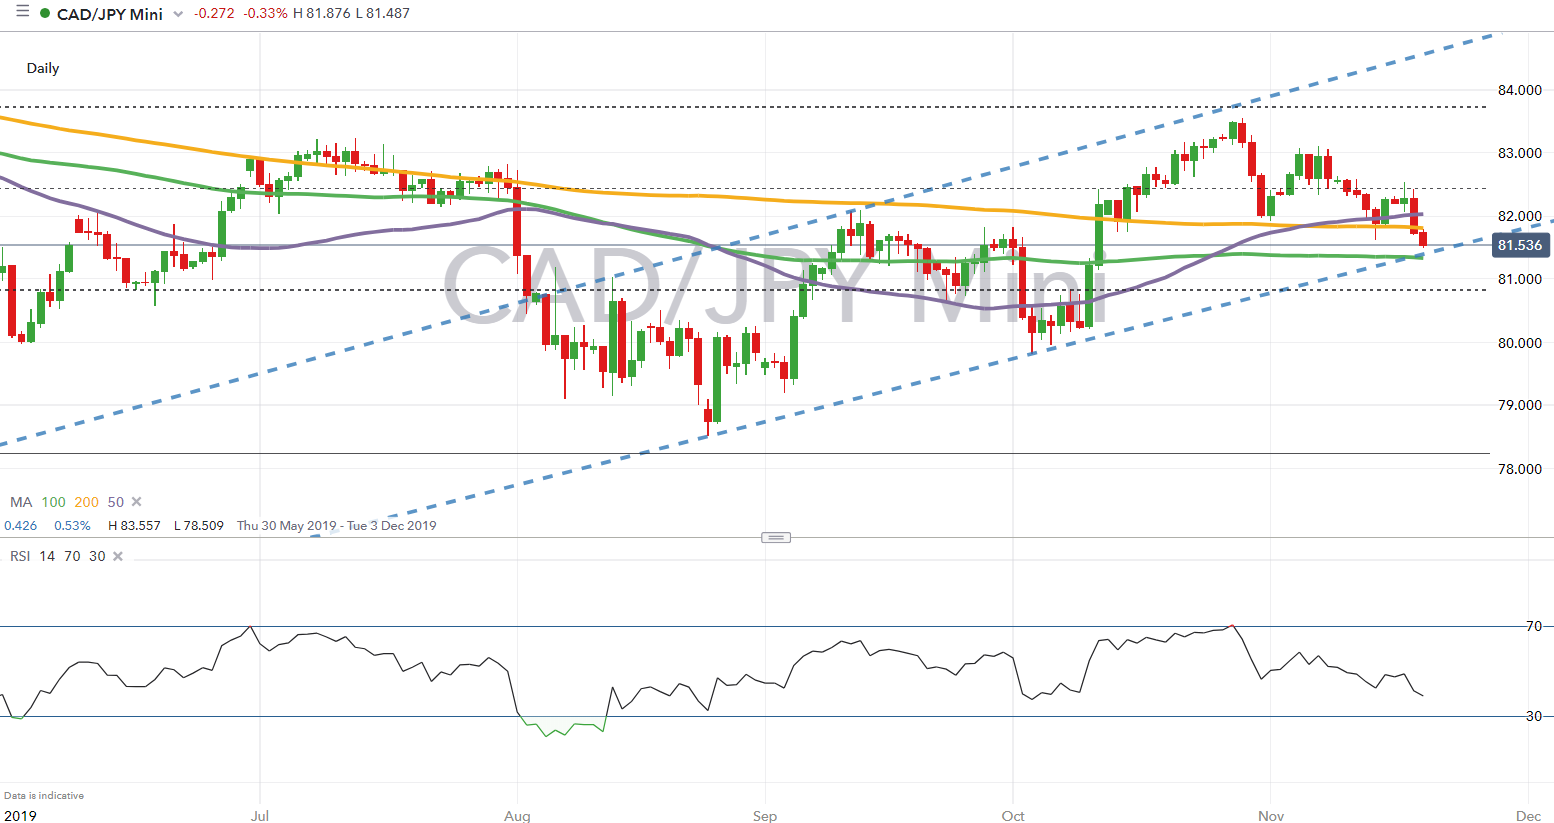
CAD/JPY | Risks Deeper Losses
Following yesterday’s weakness in the Canadian Dollar, the cross broke below both the 50 and 200DMA and thus looks set to test the lower bound its rising channel. Consequently, further losses look set to be on the horizon for CAD/JPY on a break below its rising channel, which also coincides with the 100DMA. In turn, this could open up the doors for a move south of the 81.00 with the 23.6% fib at 80.82.
CAD/JPY Price Chart: Daily Time Frame (May 2019 – Nov 2019)
--- Written by Justin McQueen, Market Analyst
To contact Justin, email him at Justin.mcqueen@ig.com
Follow Justin on Twitter @JMcQueenFX


