


CAD Analysis and Talking Points
- USDCAD | Recent Uptrend Coincides with Weak Momentum
- CADJPY | Key Support Holds
- GBPCAD | Outlook Weak, Topside Resistance Situated at 1.7450-60
See the DailyFX Q2 FX forecast to learn what will drive the currency throughout the quarter.
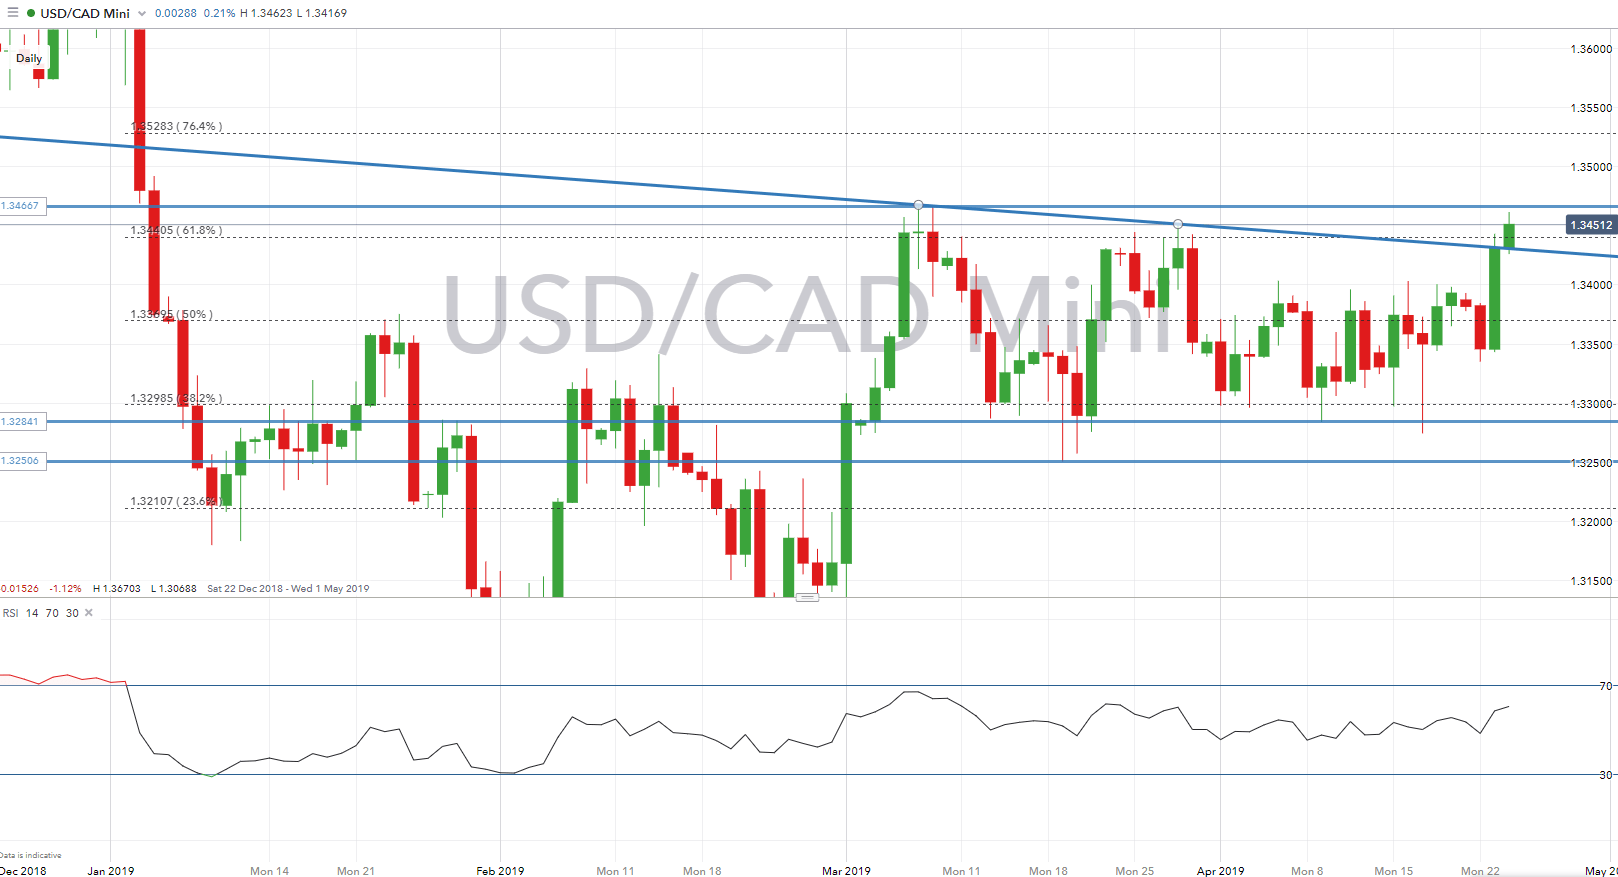
USDCAD | Recent Uptrend Coincides with Weak Momentum
Gains in the USD index put the short-term range under threat with USDCAD breaking above the 1.34 handle, which saw a test of March 7-8th peak (1.3466), while the pair had also pushed through trendline resistance. Momentum behind the recent uptrend however, has been relatively weak, thus raising the possibility of a pullback. On the downside support is situated at the 1.3325-1.3340 area whereby the 50 and 100DMA resides. If indeed there is a topside break, resistance is seen at 1.3490-1.3500. USDCAD option implied volatility for today’s BoC rate decision jumped to the highest since the January decision with a break-even of 64pips. (For currency volatility report, click here)
USDCAD PRICE CHART: Daily Time Frame (Jan 2019 – Apr 2019)
CADJPY | Key Support Holds
CADJPY continues to lack firm direction with the cross trading within a relatively narrow range having rejected trendline resistance and meeting support at the 83.00 handle. A break below support paves the way for a move towards the 38.2% Fib level, however, momentum indicators continue to point towards a modestly bullish bias, which in turn could see the cross set its sights back on trendline resistance.
CADJPY PRICE CHART: Daily Time Frame (Aug 2018–Apr 2019)

GBPCAD | Outlook Weak, Topside Resistance Situated at 1.7450-60
With GBP gains limited amid the uncertainty regarding Brexit, the outlook for GBPCAD remains weak. Momentum indicators lean towards a bearish bias, although, support stemming from the 1.7300 handle has halted further declines in the cross for now. A break below however, opens the potential to test the 200DMA (1.7122), which also coincides with the 50% Fib. On the topside, key resistance is situated at the 1.7450-1.7460 area.

--- Written by Justin McQueen, Market Analyst
To contact Justin, email him at Justin.mcqueen@ig.com
Follow Justin on Twitter @JMcQueenFX


