


CAD Analysis and Talking Points
- USDCAD | Pair Looks to Test Psychological Resistance
- EURCAD | Upside Momentum Stalling as Moving Averages Curb Gains
- CADJPY | Bearish Turn Persists
See the DailyFX Q1 FX forecast to learn what will drive the currency throughout the quarter.
USDCAD | Pair Looks to Test Psychological Resistance
The pair have continued to extend a move higher following last weeks bounce off the 200DMA. This in turn has now seen USDCAD make a topside breach of the range that has been in place since late-Jan. Consequently, the pair is now eying a move towards resistance at 1.3385-1.3400, in which a closing break could see a test of the 61.8% Fibo at 1.3440. On the downside, support resides at 1.33 and 1.3270 (100DMA)
USDCAD PRICE CHART: Daily Time Frame (Oct 2018 – Mar 2019)

EURCAD | Upside Momentum Stalling as Moving Averages Curb Gains
Recent upside in EURCAD looks to have stalled with the 50 (1.5126) and 200DMAs (1.5144) yet again putting a cap on further gains. Alongside this, momentum indicators are relatively weak, which in turn may raise scope for a potential pullback towards support at 1.5050. However, provided there is a closing break above the 200DMA, focus could shift towards a 1.53 test.
EURCAD PRICE CHART: Daily Time Frame (Oct 2018– Mar 2019)

CADJPY | Bearish Turn Persists
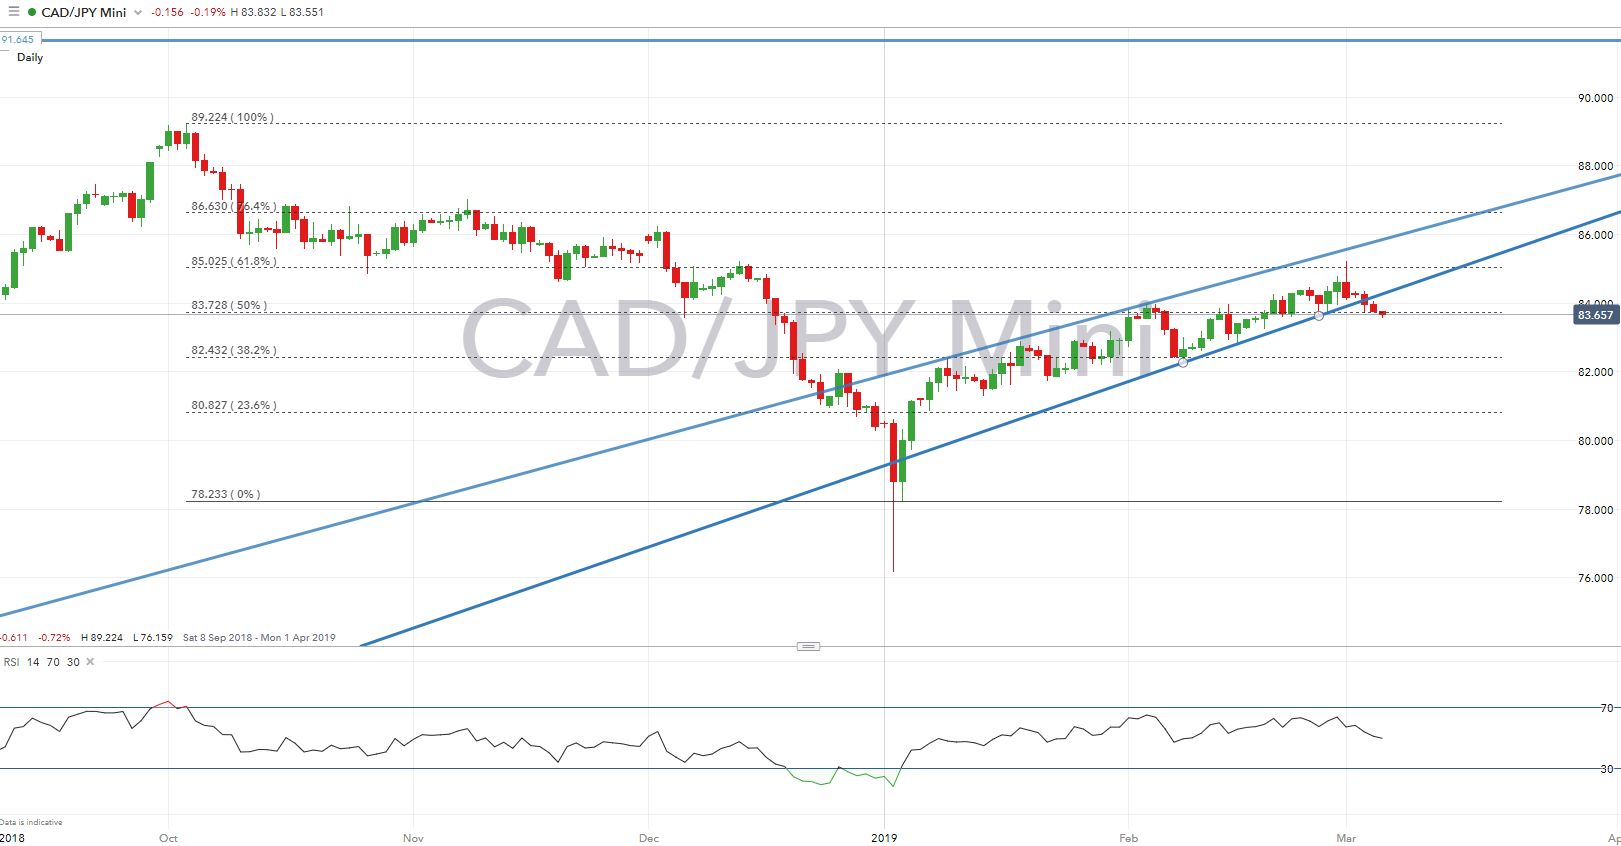
Having rejected the 61.8% Fibo at the 85.00 the bearish turn has persisted for CADJPY. As the cross edges below the 100DMA, momentum signals have continued to weaken, suggesting that losses could continue to extend. Elsewhere, there is little in the way of notable support till 82.70 and 82.40.
CADJPY PRICE CHART: Daily Time Frame (Sep 2018–Mar 2019)
--- Written by Justin McQueen, Market Analyst
To contact Justin, email him at Justin.mcqueen@ig.com
Follow Justin on Twitter @JMcQueenFX


