


AUD Analysis and Talking Points
- AUDUSD | Near-term Stabilisation as 0.71 Holds
- AUDJPY | Topside Resistance Holds, Outlook Remains Bearish
- AUDNZD | Key Support Keeps Cross Afloat
See our Q1 FX forecast to learn what will drive the currency throughout the rest of the year.
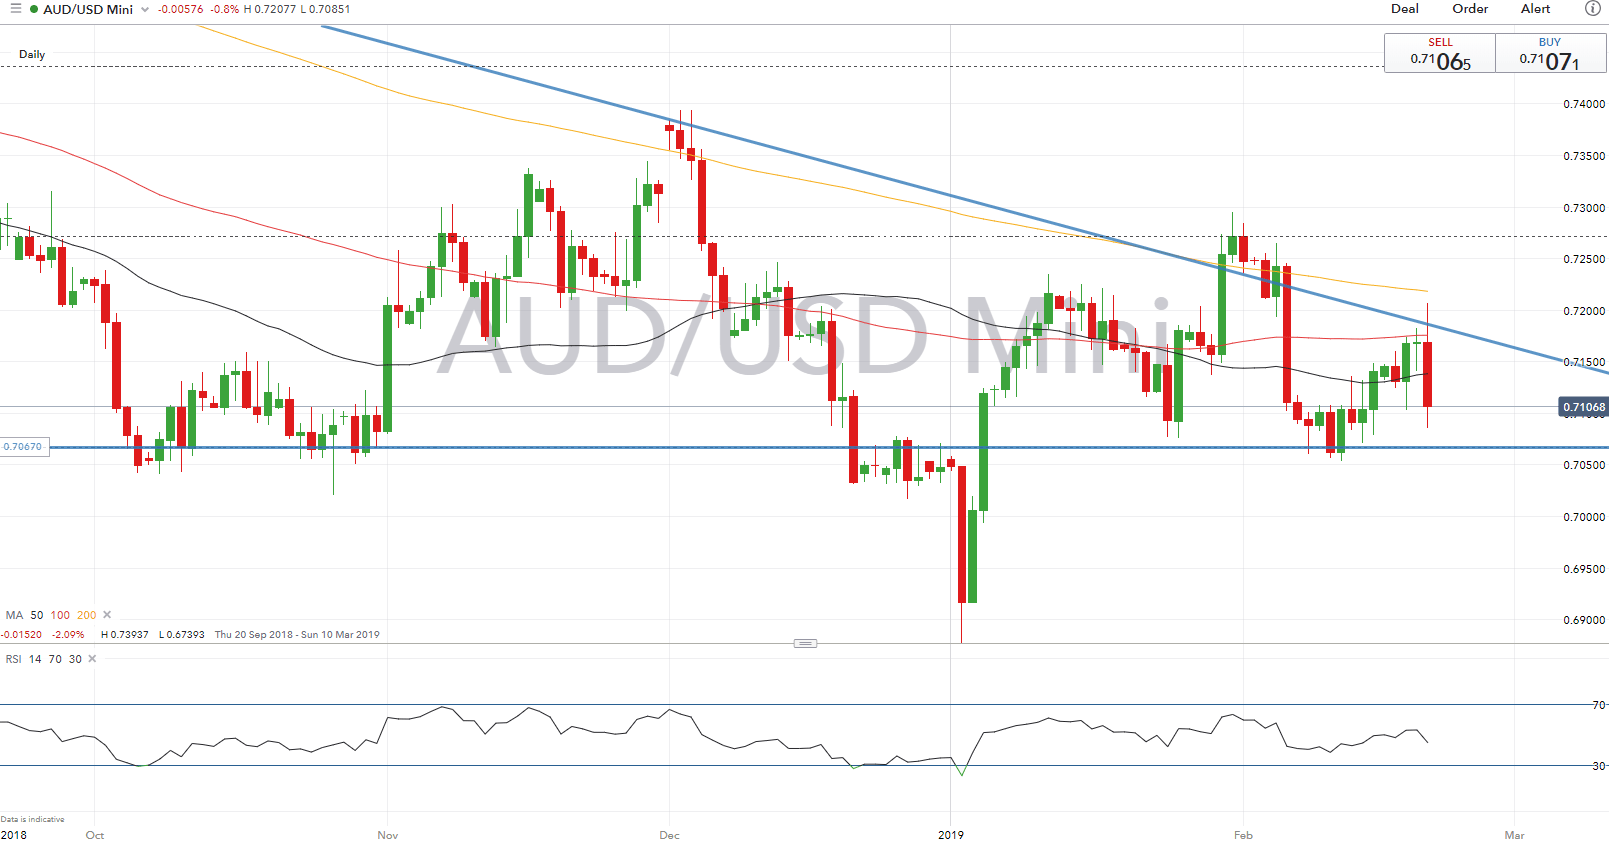
AUDUSD | Near-term Stabilisation as 0.71 Holds
AUDUSD failed to make a convincing break above the descending trendline yet again. The pair currently holding the 0.7100 handle after a somewhat excessive move to the downside. Key support situated at the 0.7067, which marks the 23.6% Fibo level. Momentum indicators remain bearish; however, this has eased in recent sessions, which in turn could see slight stabilisation in the near-term. On the topside, resistance is at 0.7180-0.7200.
AUDUSD PRICE CHART: Daily Time Frame (Sep 2018 – Feb 2019)
AUDJPY | Topside Resistance Holds, Outlook Remains Bearish
AUDJPY remains bearish below 80.00, overnight saw topside resistance at 79.80 hold firm. Momentum indicators continue to point to a bearish outlook. Eyes now on support situated at 78.40-50, whereby a firm break below could open up a move towards 78.00.
AUDJPY PRICE CHART: Daily Time Frame (Oct 2018– Feb 2019)

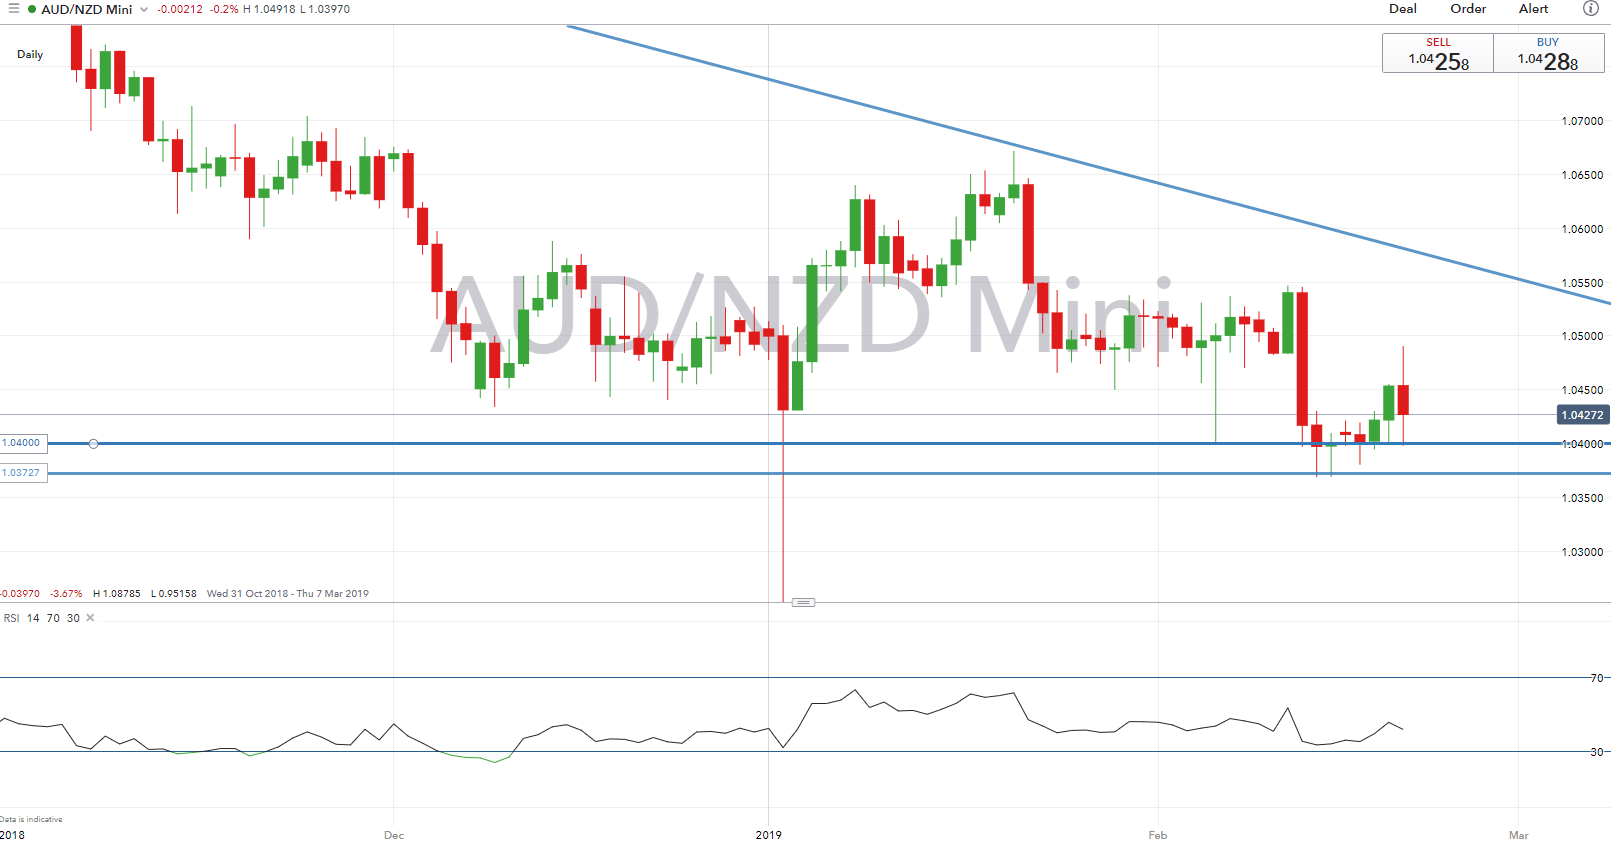
AUDNZD | Key Support Keeps Cross Afloat
Key support at the 1.04 handle continues curb AUDNZD from further losses, alongside this, bearish momentum indicators have notably eased over the past week suggesting that the cross may have based out around 1.0370. As such, there is increased scope for a move to the upside with the 50dma at 1.05 in focus.
AUDNZD PRICE CHART: Daily Time Frame (Jun 2018 – Feb 2019)
--- Written by Justin McQueen, Market Analyst
To contact Justin, email him at Justin.mcqueen@ig.com
Follow Justin on Twitter @JMcQueenFX


