


CAD Analysis and Talking Points
- USDCAD | 1.3450 Break Paves Way for Further Upside
- CADJPY | Scope for 82.00 Following Trendline Break
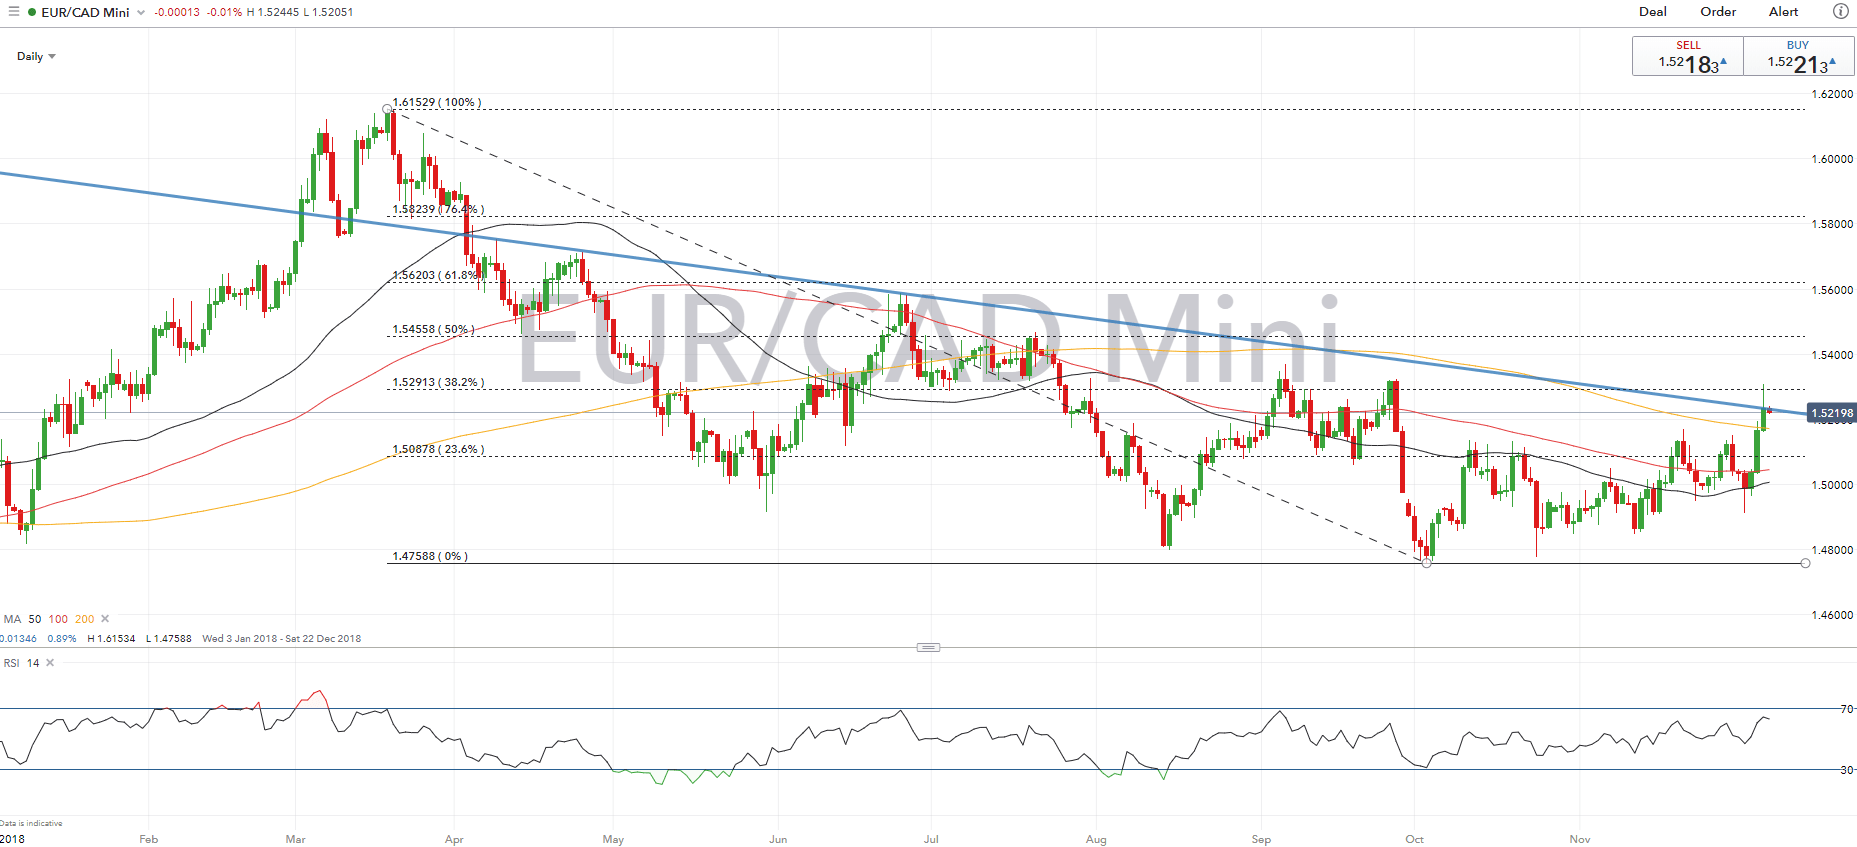
- EURCAD | Risks of Pullback, Unless Close Above Trendline
See our Q4 FX forecast to learn what will drive the currency throughout the rest of the year.
USDCAD | 1.3450 Break Paves Way for Further Upside
USDCAD continues its upward trajectory, sticking in within the rising channel. Consequently, the outlook for pair is for further upside with momentum indicators confirming this. However, trendline resistance at 1.3450 has held for now, which saw the pair pullback slightly. Eyes will be on for a break above resistance, which could see USDCAD move to test June 2017 highs at 1.3550. On the downside, support in the pair is situated at 1.3130.
USDCAD PRICE CHART: Daily Time Frame (Oct 2017 – Dec 2018)

CADJPY | Scope for 82.00 Following Trendline Break
Following the trendline break, CADJPY is increasingly bearish with momentum indicators implying further downside is in store for the cross. As such, this has increased scope for a move towards the 82.00 handle. On the downside, support is seen at 83.16, which marks the 23.6% Fibonacci retracement.
CADJPY PRICE CHART: Daily Time Frame (Oct 2017– Dec 2018)

EURCAD | Risks of Pullback, Unless Close Above Trendline
EURCAD broke out of its recent range to breach above the descending trendline. However, the cross failed to consolidate above 1.53 or close above the trendline, which in turn increase risks of a potential pullback. Alongside this, momentum indicators suggest that the trend of the move to the upside is weak. Support is seen at 1.5090. For further upside, eyes will be on for a close above the trendline at 1.5240.
EURCAD PRICE CHART: Daily Time Frame (Jan– Dec 2018)
--- Written by Justin McQueen, Market Analyst
To contact Justin, email him at Justin.mcqueen@ig.com
Follow Justin on Twitter @JMcQueenFX


