


AUD Analysis and Talking Points
- AUDUSD | Eyeing Test of Key Resistance
- AUDJPY | Little Signs of Near-Term Breakout
- AUDNZD | Bearish Momentum Indicators Moderating
See our Q4 FX forecast to learn what will drive the currency throughout the rest of the year.
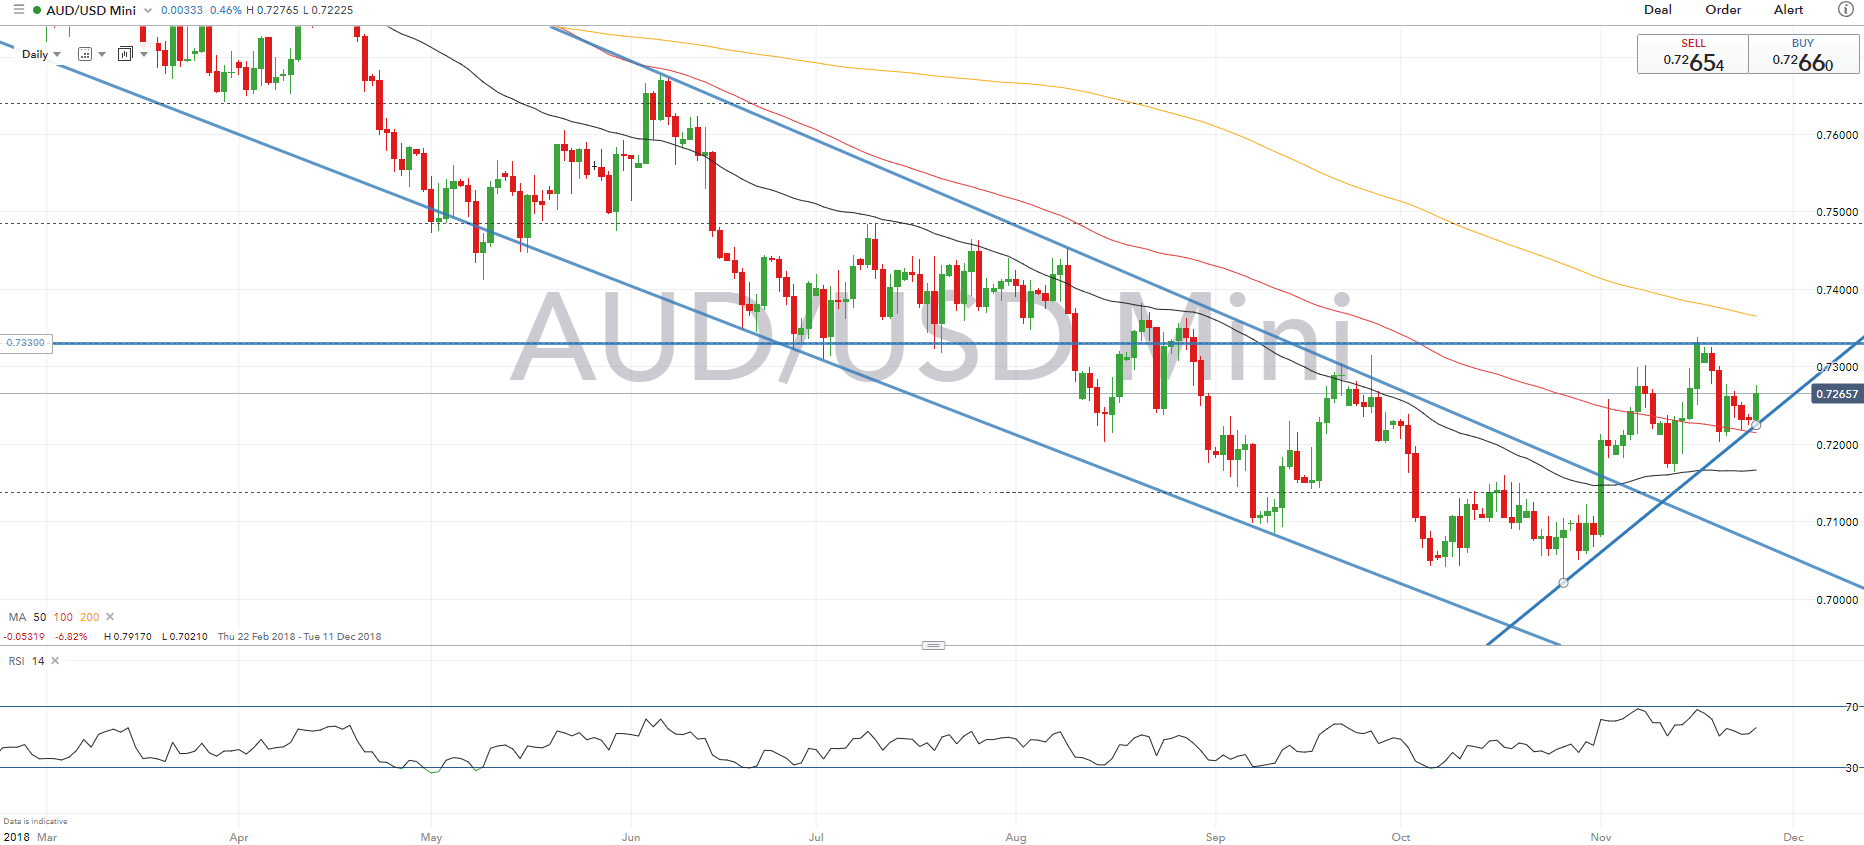
AUDUSD | Eyeing Test of Key Resistance
Buyers at the 100DMA keeps AUDUSD elevated with the pair eyeing a move back towards the 0.7300 handle. However, key resistance is situated at the 0.7330 level, which marks the 61.8 Fibonacci retracement of the 0.6827-0.8142 rise. A break above 0.7330 opens room for a test towards the 0.7400 handle. Alongside this, momentum indicators are beginning to suggest that more upside is in store for the pair.
AUDUSD PRICE CHART: Daily Time Frame (Feb – Nov 2018)
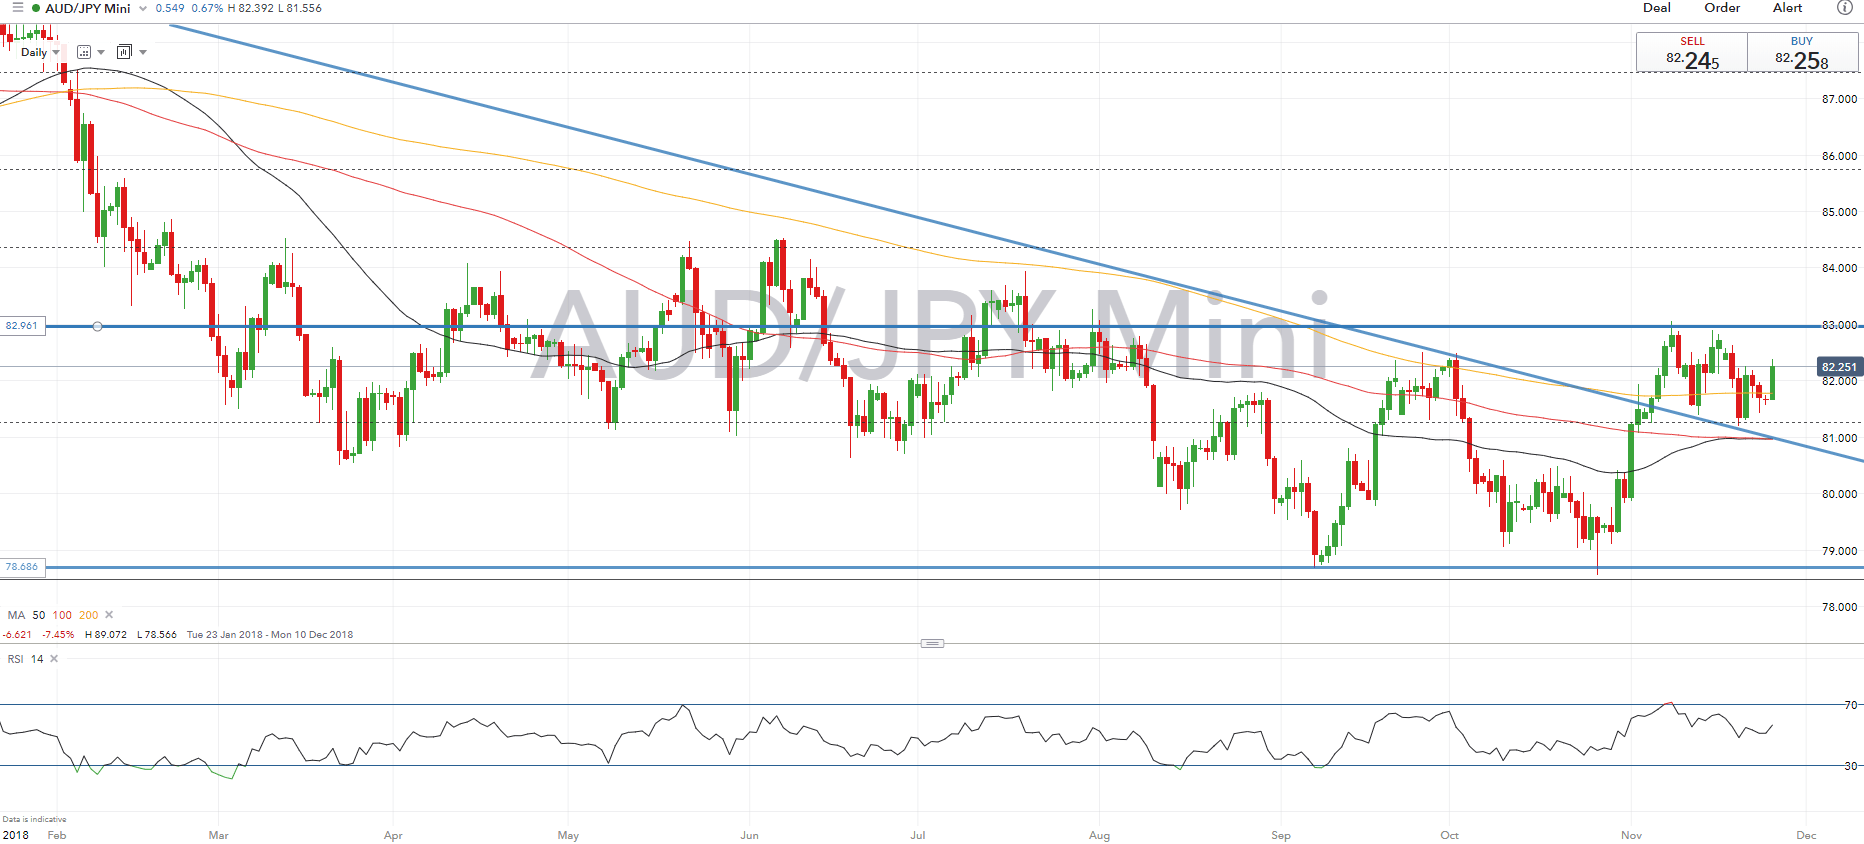
AUDJPY | Little Signs of Near-Term Breakout
The cross has extended on its gains above 82.00 and the 200DMA, as such, this has increased scope for a move towards the Nov 15th (82.90) and Nov 8th (83.05), which also coincides with a key Fib level (82.96). Little signs of a near-term breakout with the cross sticking to its November range (81.00-83.00) as momentum indicators suggest a lack of firm direction.
AUDJPY PRICE CHART: Daily Time Frame (Jan– Nov 2018)
AUDNZD | Bearish Momentum Indicators Moderating
AUDNZD edging back towards the 1.07 handle, however, the rise in the cross has struggled above the 23.6% Fibonacci retracement situated at 1.0677. Alongside this, the trend remains to the downside, however, bearish momentum indicators have moderated, while support at the 1.06 handle has kept the cross underpinned. On the upside, there is little in the way of notable resistance till 1.08.
AUDNZD PRICE CHART: Daily Time Frame (Mar– Nov 2018)

G10 FX Technical Reports
--- Written by Justin McQueen, Market Analyst
To contact Justin, email him at Justin.mcqueen@ig.com
Follow Justin on Twitter @JMcQueenFX


