


EUR Analysis and Talking Points
- EURUSD Short Term Softness, Long Term Gain
- EURJPY bias remains to the upside
- EURCAD Trend Signals Weak, Cross on the Verge of Heading Lower
See our Q3 FX forecast to learn what will drive the currency through the quarter.
EURUSD Short Term Softness, Long Term Gain
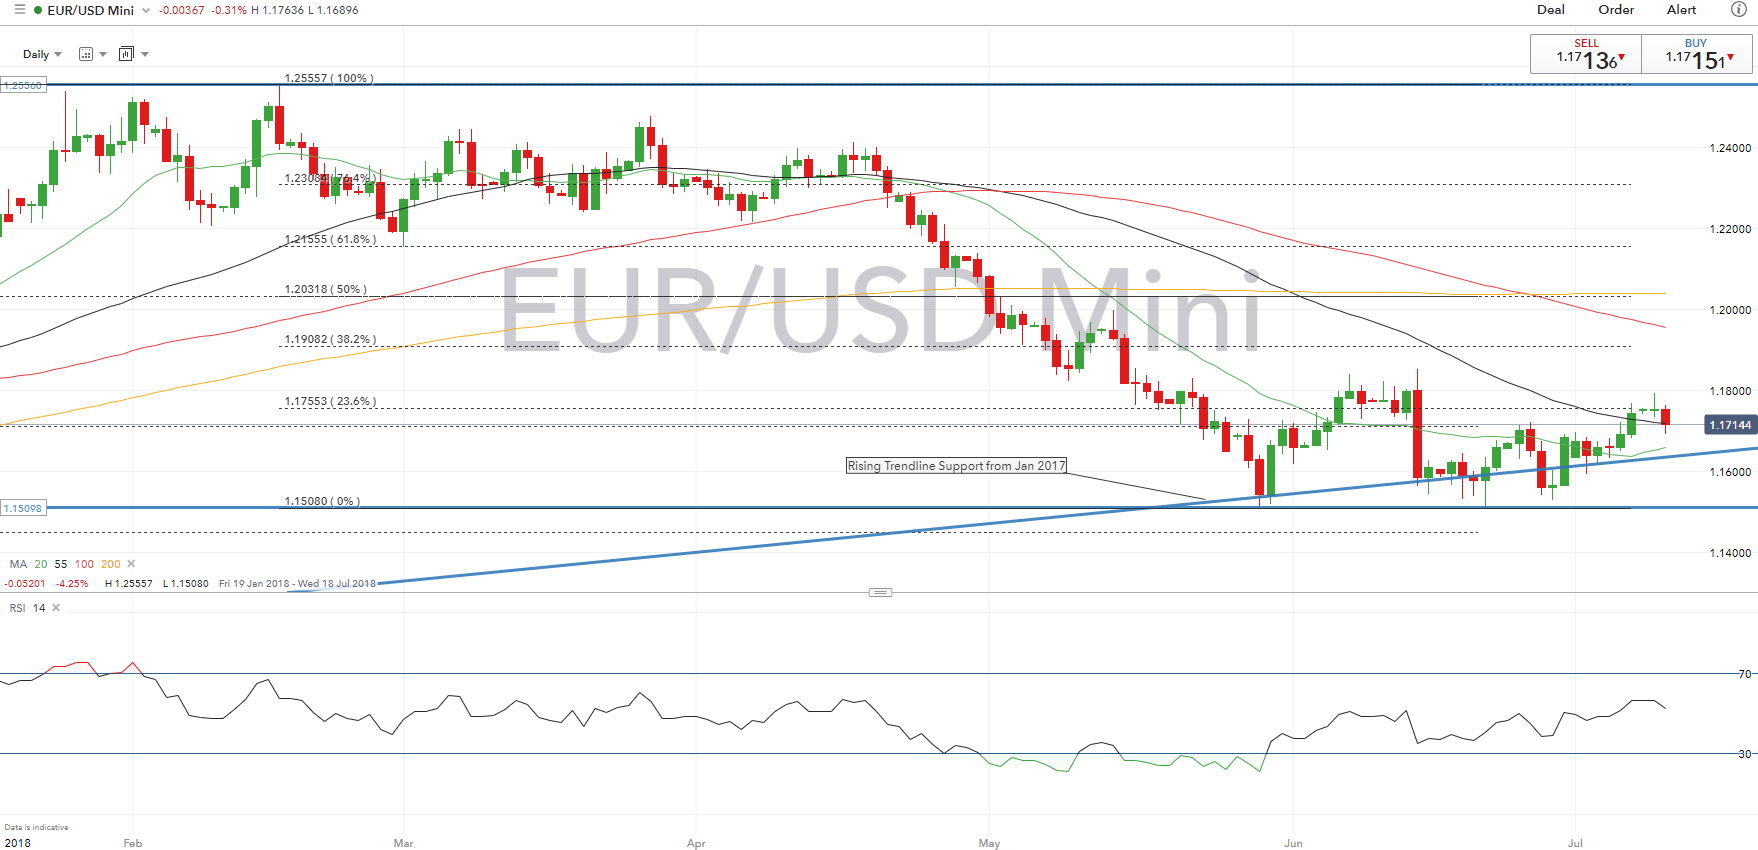
Gains in the pair stalled ahead of the 1.18 handle, while the failure to close above resistance at 1.1775, allows for the pair test lower levels at 1.17, however, the rising trendline from Jan 2017 continues to offer support. Previous resistance at 1.1720 will be the next target on the upside with 1.1755, which marks the 23.6% Fibonacci retracement of the 2018 peak – 2018 low another level of interest on the upside. In the short term, EURUSD has softened, however, on the weekly timeframe, momentum is towards the upside, a close above the aforementioned 1.1775 level can allow for a run in on 1.1820.
IG Client Positioning Sentiment states that the combination of current sentiment and recent changes gives us a stronger EURUSD-bullish contrarian trading bias. For full client positioning click here
EURUSD PRICE CHART: Daily Time Frame (January 2018-July 2018)
EURJPY bias remains to the upside
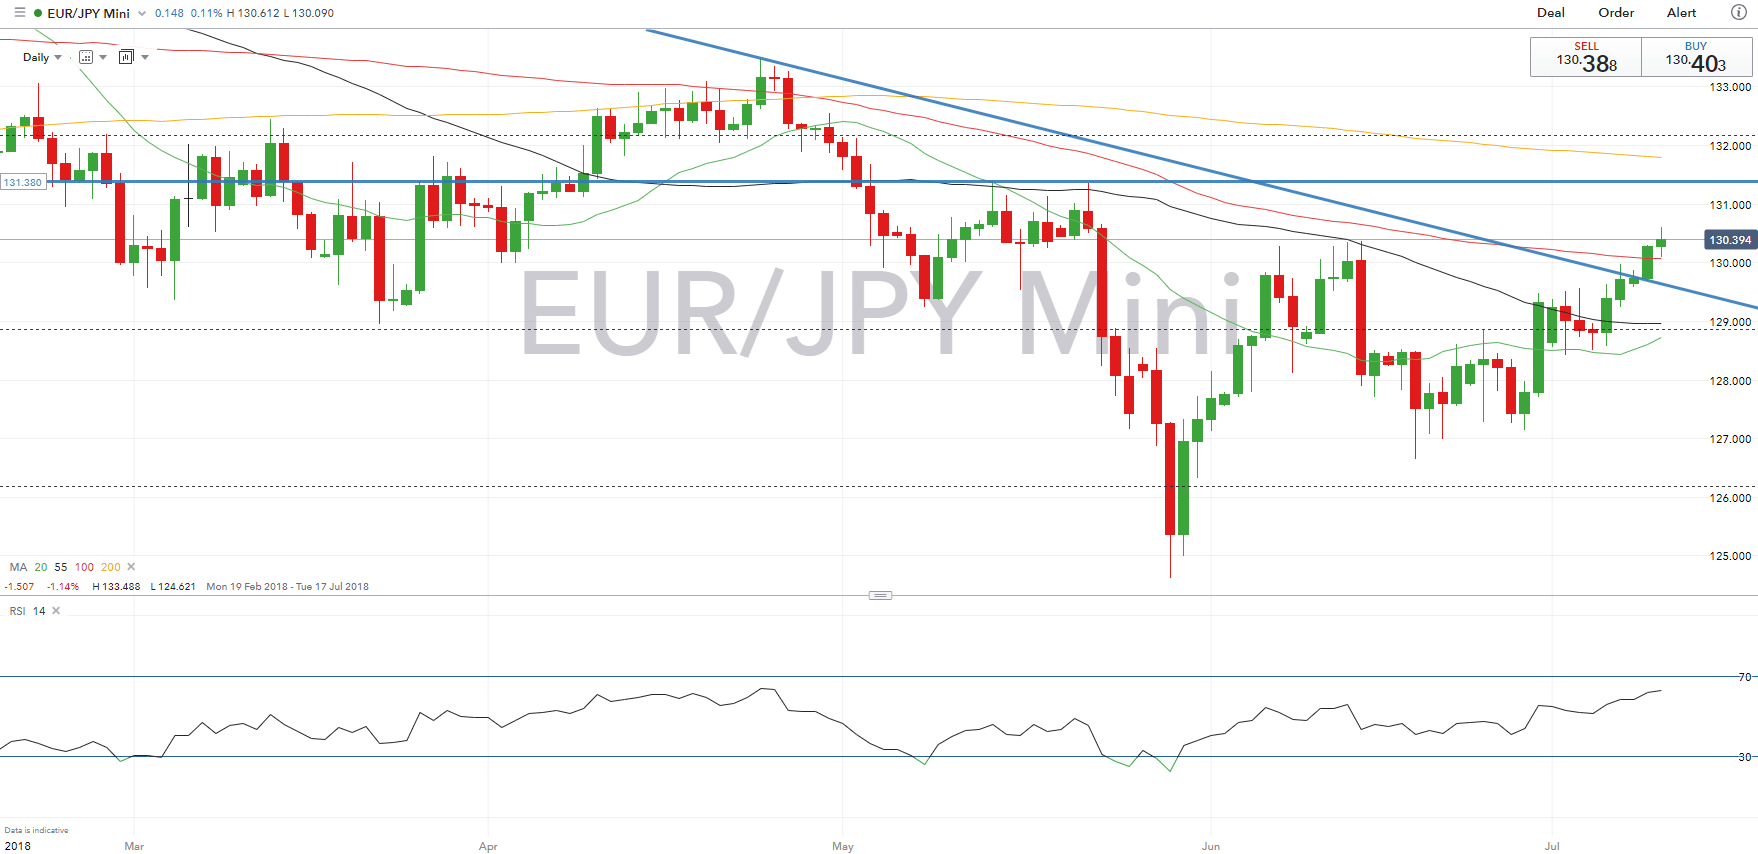
Upside bias in the cross remains intact having made a break above the trendline resistance from the 2018 high. Following the break, eyes are now on the double top posted in May at 131.40, before a grind towards the 132 handle. The 100DMA situated at 130.10 now acts as support for the cross, while RSI indicators suggest that there is more room for further gains with the index not yet moved into overbought territory.
EURJPY PRICE CHART: Daily Time Frame (February 2018 – July 2018)
EURCAD Trend Signals Weak, Cross on the Verge of Heading Lower
The cross is softer on the day, potentially signalling a reverse lower in the cross. The 200DMA and 38.2% Fibonacci retracement (1.6150-1.4910 fall) at 1.5390 continues to hold for now. However, trend signals remain weak, while momentum indicators are slowing, which in turn could suggest that prices are heading lower. Support seen at the 1.5290-1.5300 before the 55DMA sitting at 1.5260.
EURCAD PRICE CHART: Daily Time Frame (March 2018-July 2018)

--- Written by Justin McQueen, Market Analyst
To contact Justin, email him at Justin.mcqueen@ig.com
Follow Justin on Twitter @JMcQueenFX


