


Talking Points:
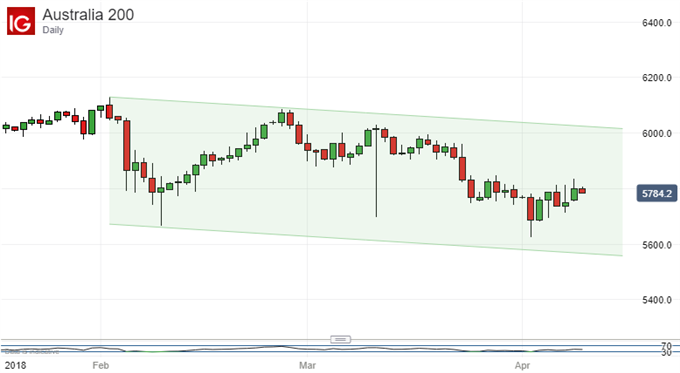
- The ASX 200 remains dominated by a gradual downtrend channel
- Within that, it has been range-trading for a couple of weeks
- But another downside break could be tough for the bulls
Find out what the #1 mistake that traders make is, so that you can avoid it.
The ASX 200 remains in the middle of the downtrend channel which has dominated trade for much of this year and looks set to stay there.
It’s below its 20-, 50- and 100-day moving averages, but not very far below. Moreover, none of them shows the sort of crossover which might suggest a trend shift. The Relative Strength Index suggests that Sydney’s equity benchmark is neither overbought nor oversold.
This certainly does not look much like a downtrend worth fighting, and that impression will only be bolstered if the index makes the lower high now threatened on its daily chart. Interestingly perhaps, AUD/USD is in a similar position. There too range trade within a downtrend is under threat, perhaps suggesting that overall risk appetite is driving both markets leveraged as they are to the global growth cycle.
Still, the previous ASX peak of 5849.9 was scaled intraday on March 27 and indeed forms the top of a minor range, which has endured since March 22. A modest uptrend has been in place from the lows of April 2 but it seems to be petering out before it gets to that peak.
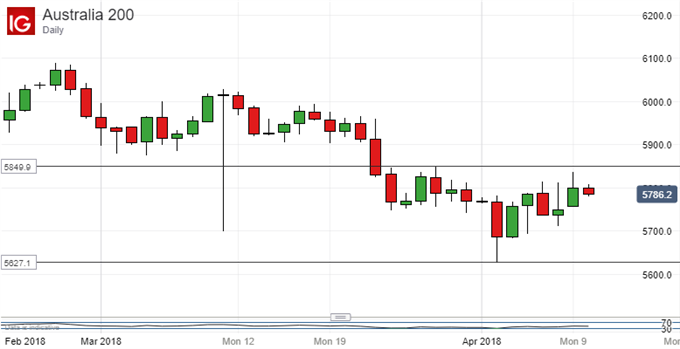
We can’t be certain yet that it has failed, but more daily closes, or a weekly close, below that point will put focus on that April 2 closing low once more. It comes in at 5864.3. Below that the same day’s intraday low will be threatened. That’s 5827.1, the current range base.
That could prove to be a crucial level for the ASX because it’s also the bottom of the extraordinary, narrow range which entirely bounded trade between May and October last year.
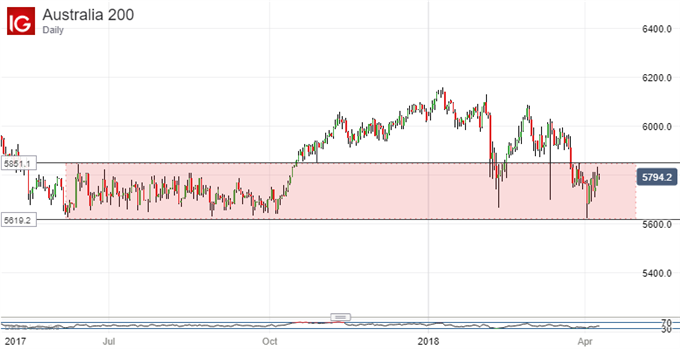
A break below that could be quite sobering for the remaining bulls out there. It would put at least the climb up from last November’s lows into fresh doubt. They came in around 5100.
Resources for Traders
Whether you’re new to trading or an old hand DailyFX has plenty of resources to help you. There’s our trading sentiment indicator which shows you live how IG clients are positioned right now. We also hold educational and analytical webinars and offer trading guides, with one specifically aimed at those new to foreign exchange markets. There’s also a Bitcoin guide. Be sure to make the most of them all. They were written by our seasoned trading experts and they’re all free.
--- Written by David Cottle, DailyFX Research
Follow David on Twitter @DavidCottleFX or use the Comments section below to get in touch!


