


Talking Points:
- Crude Oil Prices Rebound From Yearly Lows
- Daily Resistance Found at $51.34
- Looking for additional trade ideas for crude oil & commodities markets? Read Our Market Forecast
Crude oil prices are rebounding this week, after breaking out to new 2017 lows earlier in the month. Technically,previous daily support for crude oil was found at $51.34. Now with the commodity retracing, this value is now acting as a key value of daily resistance. If prices fail to breakout above $51.34, traders may look for crude to turn back lower, and dip back below the 10 day EMA (exponential moving average) found at $49.32. In the event that prices remain supported here, a technical breakout would suggest that the commodity is then prepared to again challenge the standing 2017 high at $55.67.
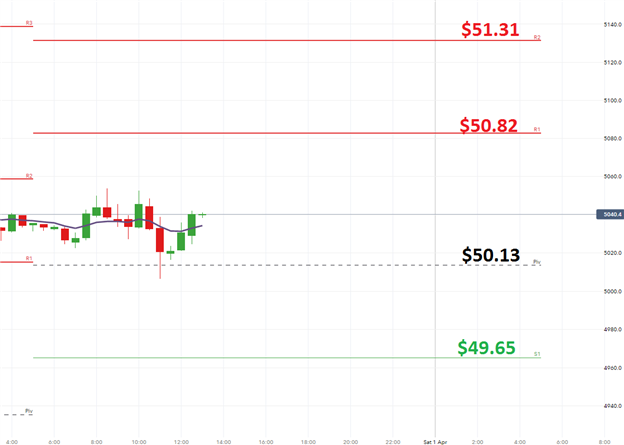
Crude Oil Price, Daily Range with Average

Intraday analysis has crude oil trading just above today’s central pivot found at $50.13. If prices continue to rally, the next points of intraday resistance include the R1 and R2 pivots found at $50.82 and $51.31. Traders should continue to monitor today’s R2 pivot for a breakout. In this bullish scenario, it would open up the possibility that crude oil would also break above the previously mentioned daily value of resistance at $51.34.
In the event of a bearish turn, traders may look for prices to find support near $49.65. A breakout below this point should be seen as significant as it would place crude oil in a position to then test the 10 day EMA at $49.32. In this bearish scenario, traders may look for the next key value of intraday support at the S2 pivot which is found at $48.95.
Sentiment analysis for crude oil prices (Ticker: US Crude), shows the majority of traders positioned net long. The current SSI ratio seen below stands at +1.83. With 64.7% of traders positioned long, this typically suggests that crude oil prices may be positioned to again decline. In the even that a bearish breakout occurs, traders may look for SSI figures to shift towards new positive extremes of +2.0 or greater next week. Alternatively in the even that crude oil pushes higher, it would be expected to see sentiment ratios shift back towards a more natural value and the potentially shift to a negative reading.

--- Written by Walker, Analyst for DailyFX.com
To Receive Walkers’ analysis directly via email, please SIGN UP HERE
See Walker’s most recent articles at his Bio Page.
Contact and Follow Walker on Twitter @WEnglandFX.


