


Talking Points:
- USD/CAD finding support below 1.31 after Crude Oil prices surged
- US PCE and Canada’s GDP numbers are in focus ahead
- 200-day moving average, key resistance zone above 1.32 still a major hurdle for USD/CAD bulls
The USD/CAD found some support below the 1.31 figure after the pair declined sharply when OPEC surprised the market by announcing outlines for a production cut.
Looking ahead, Canada GDP and US PCE headline the economic docket but “Fed-speak” and Baker Hughes are also in focus.
Against this backdrop we will form our outlook and look to find short term trading opportunities using different tools such as the Grid Sight Index (GSI) indicator.
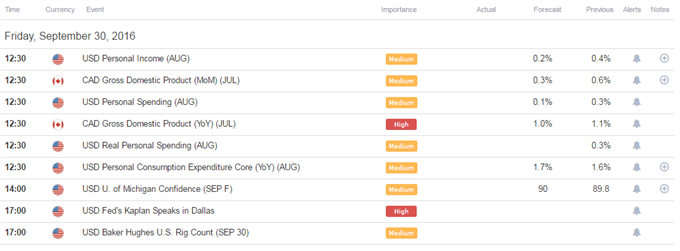
Click Here for the DailyFX Calendar
Canada’s Gross Domestic Product (GDP) report is expected to show GDP rose by an annualized 1.0%, versus the prior 1.1% print.
In their last policy press release, the BOC said that they still project a substantial rebound in the second half of this year after 2Q GDP was pulled down by the Alberta wildfires in May and by a disappointing drop in exports.
The market apparently interpreted the release as leaning slightly to the dovish side on a potential weaker outlook for inflation.
Indeed, the Canadian economy is recovering from the oil shock and a collapse in exports, which brought on a record trade gap for the country, but a positive indication for better than expected GDP and stronger exports (which Poloz emphasized as key for the economy’s recovery) could prove supportive for the Loonie.
US August PCE is on tap at the same time, and the Fed’s favored inflation gauge is set to print 1.7% for the core year-on-year figure, higher than the prior 1.6% print.
A significant deviation from expectations might be required to push Fed rate hike bets higher as it seems the market is displaying a lack of motivation and skepticism about the Fed actually hiking in December.
“Fed-speak” is also in focus today, with scheduled remarks by Kaplan. Traders should be aware of the speech, but if the recent history is an indication, the market appears to be content with the current probabilities for a December hike around 52% (based on Fed fund futures).
The Baker Hughes rig count is also on tap. Signs of increasing demand on more drilling activity could support the recent move higher in Crude Oil prices, which seemed to have been caused by the OPEC announcement.
The USD/CAD traded sharply lower on that news, but has since found some support below 1.31 as stocks traded lower on Deutche Bank concerns, while Crude Oil prices edged lower into today.
Continued risk aversion and Crude Oil weakness could prove supportive for the US Dollar, but the 200-day moving average and a key resistance zone above 1.32 still pose major hurdle for USD/CAD bulls.
USD/CAD Technical Levels:

Click here for the DailyFX Support & Resistance tool
We use volatility measures as a way to better fit our strategy to market conditions. The USD/CAD is seeing a slight pickup in implied volatility measures and 20-day ATR readings are edging higher as well.
In turn, this may imply that the breakout type of plays might be appropriate in the lower time frames, but it seems like a clear catalyst may need to present itself to see the pair clear the longer term resistance zone above 1.32.
USD/CAD 30-Min Chart: September 30, 2016

(Click to Enlarge)
The USD/CAD is reacting nicely from a resistance area below 1.32.
Other resistance levels to watch in the short term might be the area above 1.3250.
Levels of support may be found at 1.3150, 1.3100, 1.3060 and 1.30.
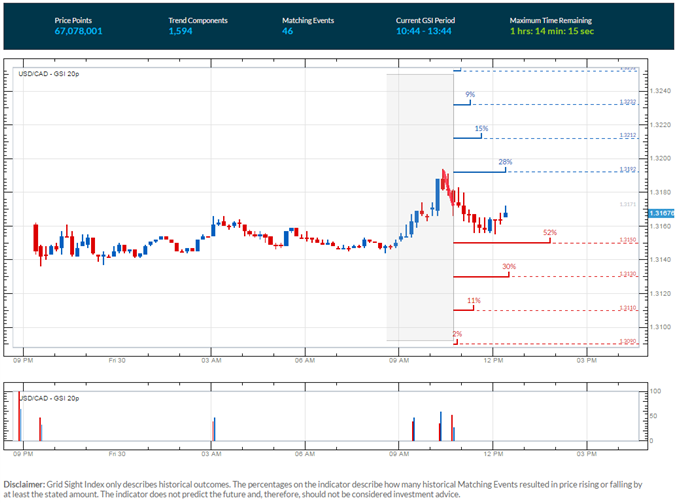
In the short term, GSI is showing similar momentum pattern indeed continued to the downside more often than not.
The GSI indicator above calculates the distribution of past event outcomes given certain momentum patterns. By matching events in the past, GSI describes how often the price moved in a certain direction.
You can learn more about the GSI here.
We generally want to see GSI with the historical patterns significantly shifted in one direction, which alongside a pre-determined bias and other technical tools could provide a solid trading idea that offer a proper way to define risk.
--- Written by Oded Shimoni, Junior Currency Analyst for DailyFX.com
To contact Oded Shimoni, e-mail oshimoni@dailyfx.com
Follow him on Twitter at @OdedShimoni


