


Talking Points:
- USD/CAD won back losses from the 1.30 break on a stronger US Dollar
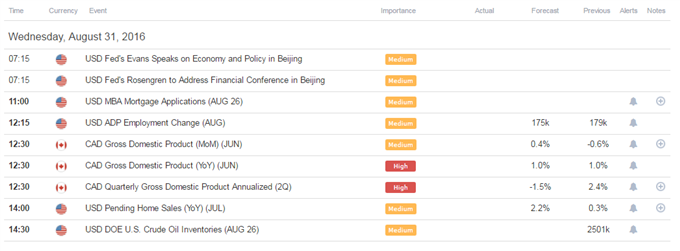
- Canada 2Q GDP and Crude Oil Inventories could be volatile for the pair
- SSI showing traders flipped net short around 1.31, potentially hinting at further gains
The USD/CAD is trading around the 1.31 handle after winning back losses following the Yellen speech at Jackson Hole.
Indeed, US Dollar strength on rising Fed rate hike expectations seem to be the major theme at the moment, potentially pressuring Crude Oil prices as well.
This puts the spotlight on the Canadian 2Q GDP figures and Crude Oil inventories data ahead for potential trade opportunities.
Against this backdrop we will form our outlook and look to find short term trading opportunities using different tools such as the Grid Sight Index (GSI) indicator.
Click Here for the DailyFX Calendar
Canada 2Q GDP is set to hit the wires 12:30 GMT.
Economists are expecting an annualized contraction of 1.5% following the 2.4% expansion in the Q1’16. The market and expectations seem to lean for a weak figure due to the Alberta fires, which means that the market might be more sensitive to a better than expected print.
With that said, the opportunity might be elsewhere this time around, which stems from the relationship between the Canadian Dollar and Crude Oil.
20-day correlation between USD/CAD and Crude Oil is sitting at -0.70 at the time of writing (weakening), while 10-day correlation has strengthened significantly in the last two days to -0.86.
Looking at Crude Oil prices in the last two days, it seems like US Dollar strength has hurt the USD-denominated WTI benchmark.
In turn, this could imply that a short term rise in Crude Oil prices based on supply and demand swings might see a knee-jerk Canadian Dollar spike, offering more favorable prices for buyers before the US Dollar strength theme quickly comes back to the spotlight. This makes the next event risk on the docket quite interesting.
The official EIA weekly Crude Oil Inventories figure is set to hit the wires 14:30 GMT. Economists are expecting a 921K addition coming into today after the prior 2501K rise.
A weaker print could potentially send Crude Oil higher alongside the Canadian Dollar.
USD/CAD Technical Levels:

Click here for the DailyFX Support & Resistance tool
We use volatility measures as a way to better fit our strategy to market conditions. The Canadian Dollar is expected to see reduced levels of volatility versus the US Dollar based on 1-week implied volatility measures.
Indeed, 20-day ATR measure confirm the lowest levels of volatility since late 2015.
In turn, this may suggest that key technical levels might be able to hold in the short term.
USD/CAD 30-Min Chart (With the GSI Indicator): August 31, 2016
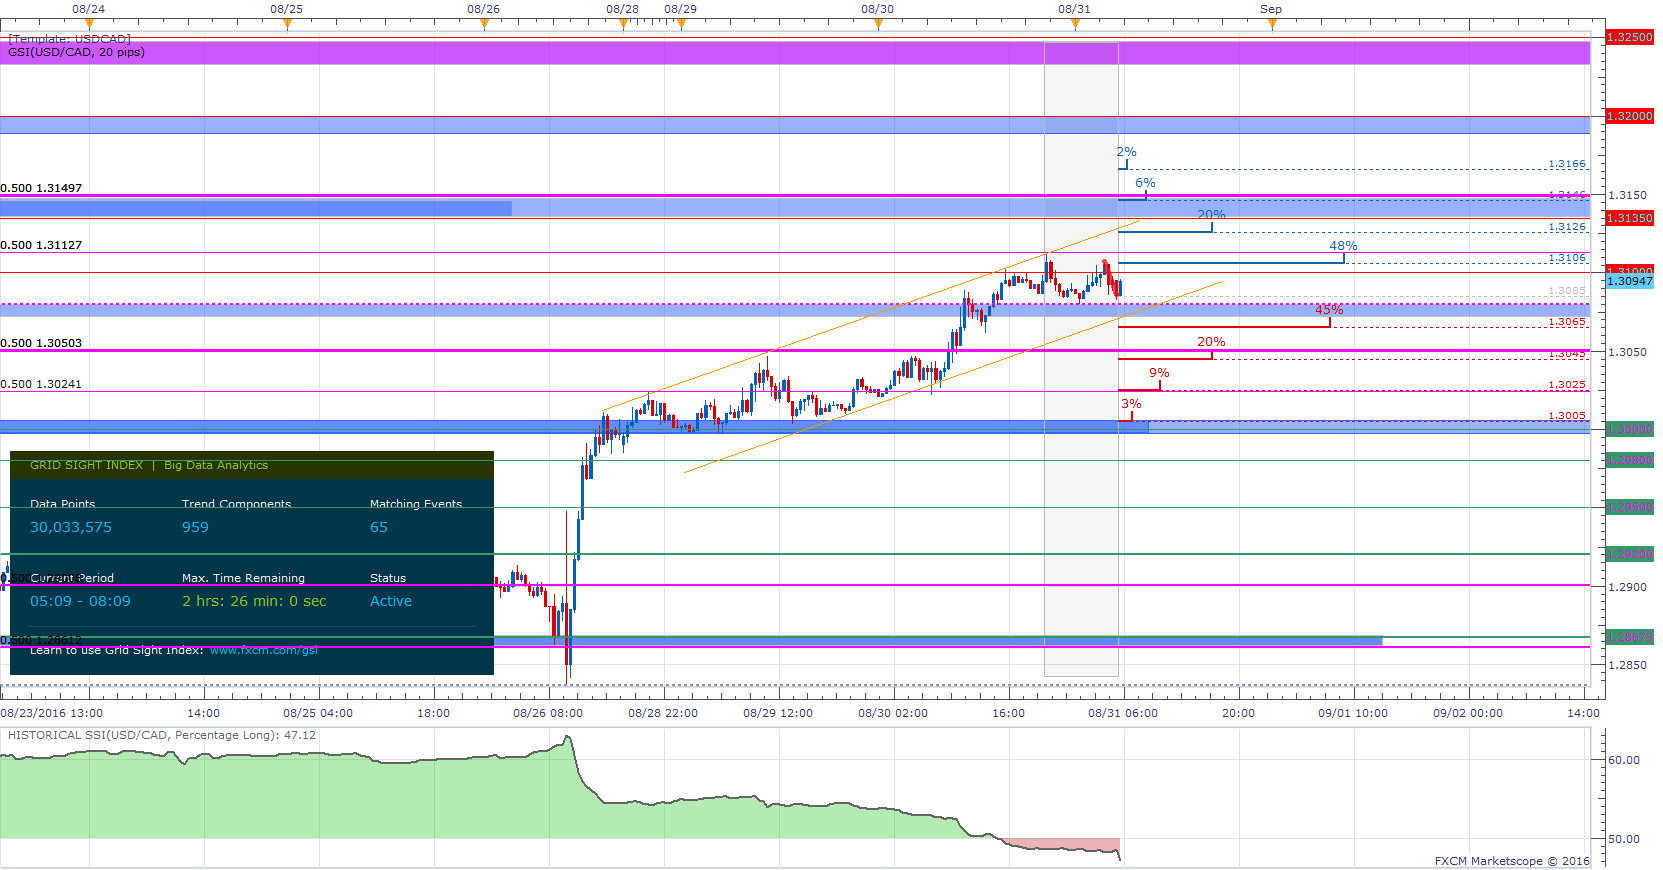
(Click to Enlarge)
The USD/CAD is trading sideways in the short term between 1.3112 and 1.3080, with GSI calculating about even percentages of past movement to either side.
The GSI indicator above calculates the distribution of past event outcomes given certain momentum patterns. By matching events in the past, GSI describes how often the price moved in a certain direction.
You can learn more about the GSI here.
Further levels of support might be 1.3050 and 1.3025 (which seem like interesting levels to watch on the potentially strengthening Oil scenario mentioned above), followed by 1.30, 1.2980 and 1.2950.
Levels of resistance may be areas below 1.3150 and 1.3200 followed by a key zone below 1.3250.
We generally want to see GSI with the historical patterns significantly shifted in one direction, which alongside a pre-determined bias and other technical tools could provide a solid trading idea that offer a proper way to define risk.
We studied over 43 million real trades and found that traders who successfully define risk were three times more likely to turn a profit.
Read more on the “Traits of Successful Traders” research.
Meanwhile, the DailyFX Speculative Sentiment Index (SSI) is showing that about 47.12% of traders are long the USD/CAD at the time of writing, after flipping short yesterday, potentially taking profits too quickly (see the “Traits of Successful Traders” research ).
You can find more info about the DailyFX SSI indicator here
--- Written by Oded Shimoni, Junior Currency Analyst for DailyFX.com
To contact Oded Shimoni, e-mail oshimoni@dailyfx.com
Follow him on Twitter at @OdedShimoni


