


Talking Points:
- AUD/USD still supported above 0.76 following Friday’s NFPs
- A quiet economic docket puts the spotlight on the China CPI data later for possible volatility
The AUD/USD is still being supported above the 0.76 handle (at the time of writing) after the pair moved lower following Friday’s blockbuster NFP report.
A quiet economic calendar ahead shifts our focus to China's July CPI data for possible volatility for the pair given the trading relations between China and Australia.
Taking this into consideration, we look to find short term trading opportunities using the Grid Sight Index (GSI) indicator.
Click Here for the DailyFX Calendar
The AUD/USD surged higher last week after the RBA cut rates to 1.5%, as the market appeared to have interpreted the central bank’s statement as not indicative of further rate cuts at the moment. In this context, the Australian Dollar may still find support as a 1.5% rate is still attractive in the current record low yield environment.
In their policy statement, the RBA said that actions by Chinese policymakers are supporting the near-term growth outlook, but the underlying pace of China's growth appears to be moderating.
This puts the China Consumer Price Index (CPI) data in focus given the trading relations between the nations.
The headline year-on-year figure is expected to slow to 1.8% from the prior print of 1.9%, far from the PBOC’s target-level for CPI of 3.0%. A miss to expectations could increase the odds of the PBOC adopting a more dovish monetary policy, which could potentially hurt the Yuan and thus imports from Australia.
AUD/USD 3-Min GSI Chart: August 8, 2016

The AUD/USD is approaching a potential resistance area above 0.7637 (see chart below), with GSI calculating higher percentage of past movement to the downside in the short term. The GSI indicator above calculates the distribution of past event outcomes given certain momentum patterns, and can give you a look at the market in a way that's never been possible before, analyzing millions of historical prices in real time. By matching events in the past, GSI describes how often the price moved in a certain direction.
You can learn more about the GSI here.
AUD/USD Technical Levels:

Click here for the DailyFX Support & Resistance tool
We use volatility measures as a way to better fit our strategy to market conditions. The AUD/USD is seeing reduced levels of volatility (on 14-day ATR study). In turn, this could imply that range bound trading plays might be appropriate ahead.
AUD/USD 30-Min Chart: August 8, 2016
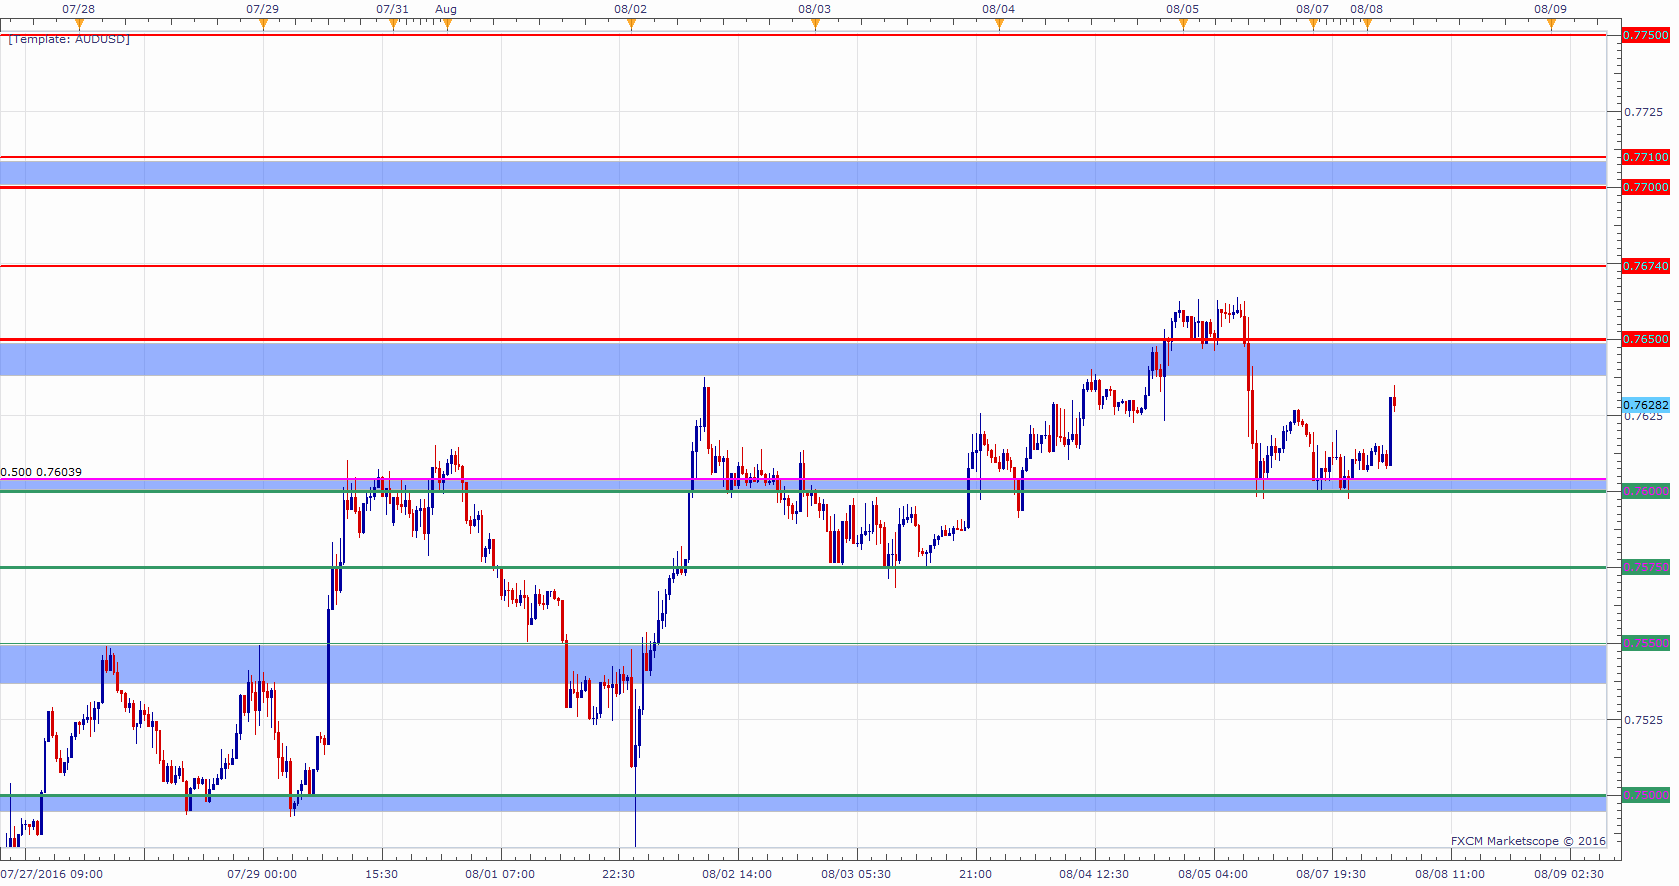
(Click to Enlarge)
The AUD/USD is trading below a potential resistance area above 0.7637. Further levels of interest on a move higher may be 0.7674, a zone above the 0.77 handle and 0.7750.
Levels of interest on a move lower could be the area above 0.76 followed by 0.7575, a zone below 0.7550 and the 0.75 handle.
When price reaches those levels, short term traders might use the GSI to view how prices reacted in the past given a certain momentum pattern, and see the distribution of historical outcomes in which the price reversed or continued in the same direction. We generally want to see GSI with the historical patterns significantly shifted in one direction, which could potentially be used with a pre-determined bias as well.
A common way to use GSI is to help you fade tops and bottoms, and trade breakouts. That’s why traders may want to use the GSI indicator when price reaches those specific pre-determined levels, and fit a strategy that can offer a proper way to define risk. We studied over 43 million real trades and found that traders who do that were three times more likely to turn a profit. Read more on the “Traits of Successful Traders” research.
Meanwhile, the DailyFX Speculative Sentiment Index (SSI) is showing that about 40.0% of traders are long the AUD/USD at the time of writing. The SSI is mainly used as a contrarian indicator implying further strength ahead.
You can find more info about the DailyFX SSI indicator here
--- Written by Oded Shimoni, Junior Currency Analyst for DailyFX.com
To contact Oded Shimoni, e-mail oshimoni@dailyfx.com
Follow him on Twitter at @OdedShimoni


