


Talking Points:
- GBP/USD trading around the 1.32 handle in early London trading hours
- UK’s June CPI data in the spotlight for potential influence on the pair
The GBP/USD is trading around the 1.32 handle (at the time this report was written) as the market continues to adjust to the post-Brexit environment.
UK’s June CPI data is the main event risk on the docket, but questions remain on impact of data representing the “pre-Brexit” world.
Taking this into consideration, we look to find short term trading opportunities using the Grid Sight Index (GSI) indicator.
Click Here for the DailyFX Calendar
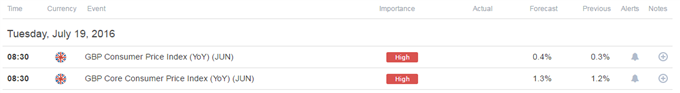
UK’s June Consumer Price Index (CPI) figures are in focus today. Expectations are for the year-on-year number to indicate an annual rise of 0.4%, above the prior 0.3% print. Core CPI is expected to print the first uptick since March at 1.3%, from the prior 1.2% figure.
Questions remain however, whether the figures will generate a significant market moving impact, since the numbers represent mostly data from the “pre-Brexit” era and a world with an exchange rate higher by about 10%. The BoE seem to expect that the sharp decline in the Sterling will push inflation higher, which might imply that the market will look past the figures until the August report.
With that said, in the last couple of days we have seen mixed comments by BoE members regarding the bank's expected easing policy. Martin Weale said that in order to loosen policy, he will need to see a weaker growth outlook large enough so that it will justify actions on the back of an overshoot to the bank's 2% inflation target.
Gertjan Vlieghe on the other hand, who voted for a cut in the last BoE rate decision, said inflation expectations beyond the next few years have fallen since the referendum from “already low levels”, and that he was considering easing even before the vote.
In turn, this could suggest that when it comes to inflation, the “pre-Brexit” numbers might have some influence on the bank’s decision makers.
We will be covering the event LIVE 08:15 GMT in the Trade Room here.
GBP/USD 5-Min GSI Chart: July 19, 2016
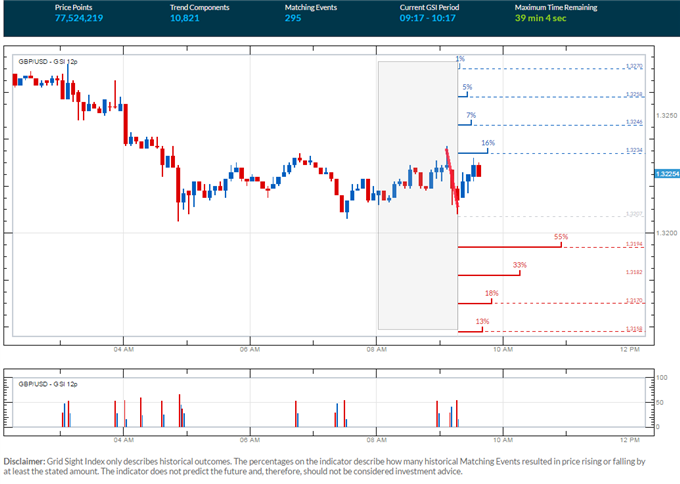
The GBP/USD is trading near possible support at the 1.32 (see chart below). The GSI indicator is implying that 55% similar past momentum events have seen downside movements. The indicator calculates the distribution of past event outcomes given certain momentum patterns, and can give you a look at the market in a way that's never been possible before, analyzing millions of historical prices in real time. By matching events in the past, GSI describes how often the price moved in a certain direction.
You can learn more about the GSI here.
GBP/USD Technical Levels:

Click here for the DailyFX Support & Resistance tool
We use volatility measures as a way to better fit our strategy to market conditions. GBP/USD implied volatility levels have been reduced lately, but remain elevated as “Brexit” related news still seem to have sharp reaction in the pair. Taking this into consideration might indicate breakout and trend oriented plays might be appropriate.
GBP/USD 30-Min Chart: July 19, 2016

The GBP/USD is trading around possible support at the 1.32 handle. Further levels of support on a move lower might be an area of confluence around 1.3150 and a potential zone of about 20 pips above the 1.31 handle, followed by the round 00s and 50s.
Levels of potential resistance on a move higher might be the 1.3250 figure and the 1.33 handle, followed by a zone below the 1.3350 level, 1.34 and what seems to be a key resistance area above 1.3465.
When price reaches those levels, short term traders might use the GSI to view how prices reacted in the past given a certain momentum pattern, and see the distribution of historical outcomes in which the price reversed or continued in the same direction. We generally want to see GSI with the historical patterns significantly shifted in one direction, which could potentially be used with a pre-determined bias as well.
A common way to use GSI is to help you fade tops and bottoms, and trade breakouts. That’s why traders may want to use the GSI indicator when price reaches those specific pre-determined levels, and fit a strategy that can offer a proper way to define risk. We studied over 43 million real trades and found that traders who do that were three times more likely to turn a profit. Read more on the “Traits of Successful Traders” research.
Meanwhile, the DailyFX Speculative Sentiment Index (SSI) is showing that about 56.7% of traders are long the GBP/USD at the time of writing. The SSI is mainly used as a contrarian indicator, implying possible further weakness ahead.
You can find more info about the DailyFX SSI indicator here
--- Written by Oded Shimoni, Junior Currency Analyst for DailyFX.com
To contact Oded Shimoni, e-mail oshimoni@dailyfx.com


