


Talking Points:
- USD/CAD trading in a narrow range in early London trading hours
- The Bank of Canada rate decision firmly in the spotlight as the pair appears to trade in anticipation
The USD/CAD is trading around the 1.3050 figure in early London trading hours, as the market appears to be trading sideways ahead of the major event risk on the docket.
July’s Bank of Canada monetary policy announcement is in the spotlight today but further event risk in the likes of the Crude Oil inventories, Fed-speak and the Fed’s Beige Book release might see increasing volatility for the pair as well.
Taking this into consideration, we look to find short term trading opportunities using the Grid Sight Index (GSI) indicator.

Click Here for the DailyFX Calendar
Bank of Canada’s July Rate Decision at 14:00 GMT today is in high focus. The BoC is expected to keep policy at status quo leaving rates unchanged at 0.50%. This might imply that attention will quickly turn to the Monetary Policy Report and the updated economic forecasts by the bank as well as the press conference later today. After the disappointing Canadian job figures this past Friday, the BoC might voice concern over slack in the job market, which may potentially imply a downbeat tone by the central bank.
Adding to pressures could be the Crude Oil Inventories data later as well. USD/CAD and Crude Oil 10-day correlation sits at -0.88 at the time of writing, implying possible swing in the pair on reactions to the data.
Dallas Fed President Kaplan is on the docket as well. Chances of a 2016 rate hike have quietly strengthened this week compared with the last week after the market didn’t meaningfully pull forward rate hike bets following Friday’s NFPs, which might imply that rate hikes were being priced out on the backdrop of the global environment, which appears likely to be, at least in part, a result of the “Brexit” vote. Comments on that front that clashes with the “global concerns” narrative might see US Dollar strength, with the Fed’s Beige Book survey also potentially adding to a positive US Dollar tone.
USD/CAD 5-Min GSI Chart: July 13, 2016
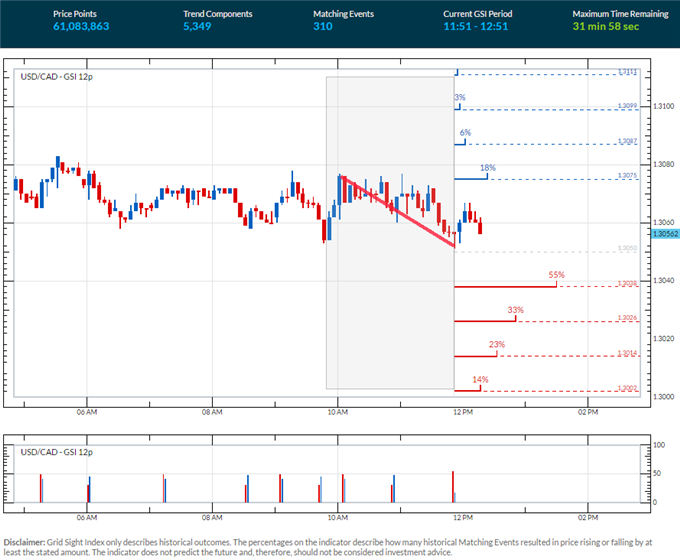
Sideways trading appears to be the order of the day for USD/CAD, at least until US trading hours, as the pair trades at a minor support level (see chart below). The GSI indicator above shows that 55% of similar past momentum events has seen downside movements. The GSI indicator calculates the distribution of past event outcomes given certain momentum patterns, and can give you a look at the market in a way that's never been possible before, analyzing millions of historical prices in real time. By matching events in the past, GSI describes how often the price moved in a certain direction.
You can learn more about the GSI here.
USD/CAD Technical Levels:

Click here for the DailyFX Support & Resistance tool
We use volatility measures as a way to better fit our strategy to market conditions. The market seems likely to remain slightly subdued until the even risk ahead, which could induce significant volatility. In turn, this may imply that breakout trades are preferable following the figures.
USD/CAD 30-Min Chart: July 13, 2016
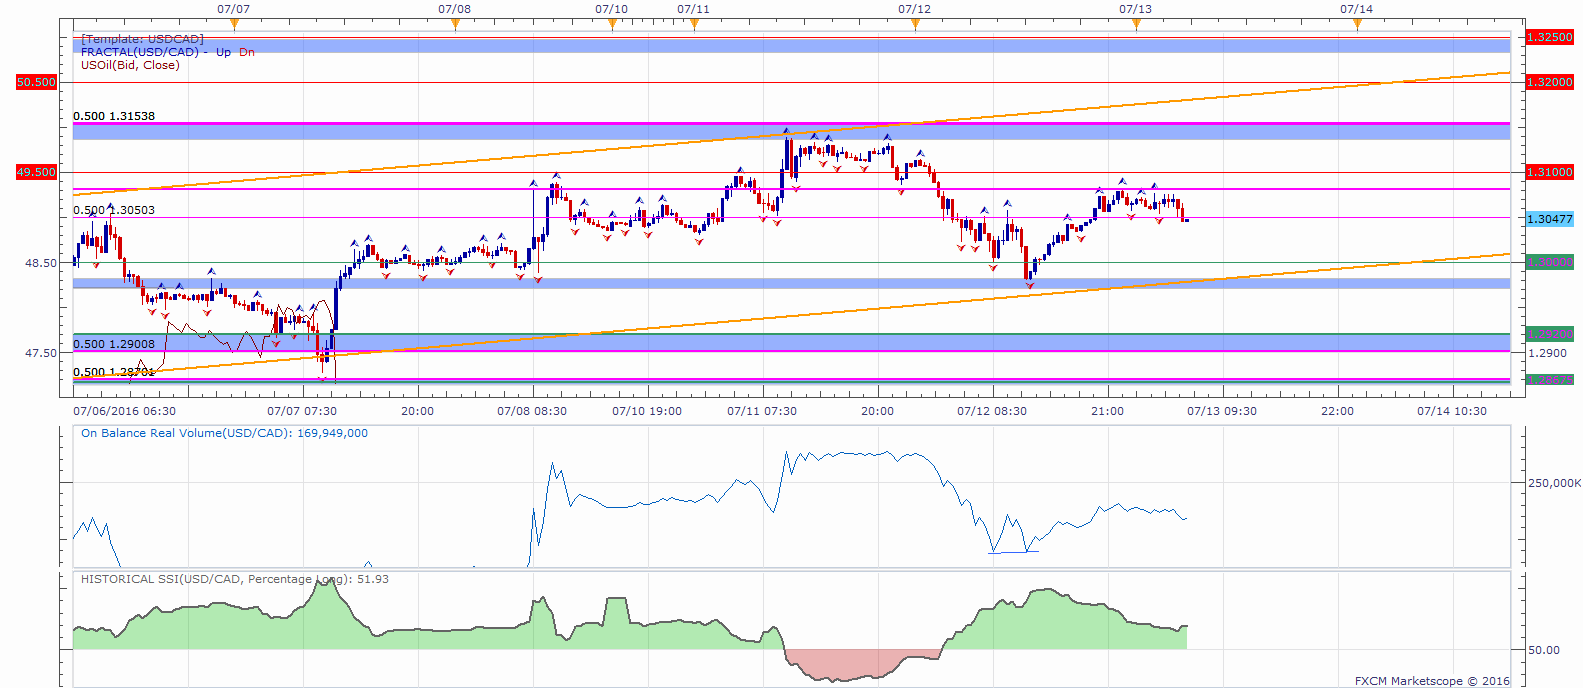
The USD/CAD is trading around minor prior support at 1.3050. Further levels of support on a move lower might be the area below the 1.30 handle which also coincides with a possible trend line support, followed by a zone above the 1.29 handle, the 1.2867 level, 1.2830 and 1.2800.
Levels of potential resistance on a move higher may be 1.3080 to 1.3100 followed by an area around the 1.3150 figure and the 1.32 handle.
When price reaches those levels, short term traders might use the GSI to view how prices reacted in the past given a certain momentum pattern, and see the distribution of historical outcomes in which the price reversed or continued in the same direction. We generally want to see GSI with the historical patterns significantly shifted in one direction, which could potentially be used with a pre-determined bias as well.
A common way to use GSI is to help you fade tops and bottoms, and trade breakouts. That’s why traders may want to use the GSI indicator when price reaches those specific pre-determined levels, and fit a strategy that can offer a proper way to define risk. We studied over 43 million real trades and found that traders who do that were three times more likely to turn a profit. Read more on the “Traits of Successful Traders” research.
Meanwhile, the DailyFX Speculative Sentiment Index (SSI) is showing that about 51.9% of traders are long the USD/CAD at the time of writing.
You can find more info about the DailyFX SSI indicator here
--- Written by Oded Shimoni, Junior Currency Analyst for DailyFX.com
To contact Oded Shimoni, e-mail oshimoni@dailyfx.com


