


Talking Points:
- NZD/USD trading around the 0.71 handle as the pair fluctuates alongside stock prices
- US ISM Non-Manufacturing Composite figure headlines the economic calendar
The NZD/USD is trading around the 0.71 handle after seeing a slight move higher following a decline yesterday that seemed to have coincided with a drop in stock prices. Indeed, 10-day correlation between the NZD/USD and the SPX 500 is 87% at the time of writing.
The US ISM Non-Manufacturing Composite figure headlines the economic calendar, and may induce some volatility for the pair, while the Fed's June Meeting Minutes seem unlikely to generate a significant response due to the “Brexit” decision.
Taking this into consideration, we look to find short term trading opportunities using the Grid Sight Index (GSI) indicator.
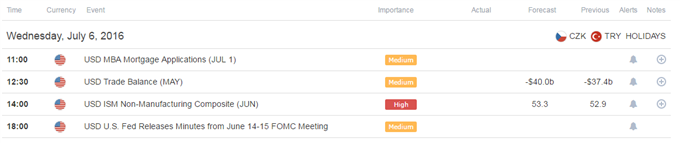
Click Here for the DailyFX Calendar
The US ISM Non-Manufacturing composite figures are in the spotlight today. The index is expected to show an improvement in June by printing 53.3 versus a prior 52.9 print. The ISM can induce volatilityat times, and price action following the release might provide hints to the market’s reaction on the upcoming NFP figures.
The Fed’s June Meeting Minutes will be released later today as well, but appear unlikely to generate significant price swings, as the market priced out any possibility for a rate hike this year (as per the Fed funds futures)- the fact that the meeting was held before the “Brexit” vote might imply that the minutes are unlikely to change the market’s view.
NZD/USD 5-Min GSI Chart: July 6, 2016
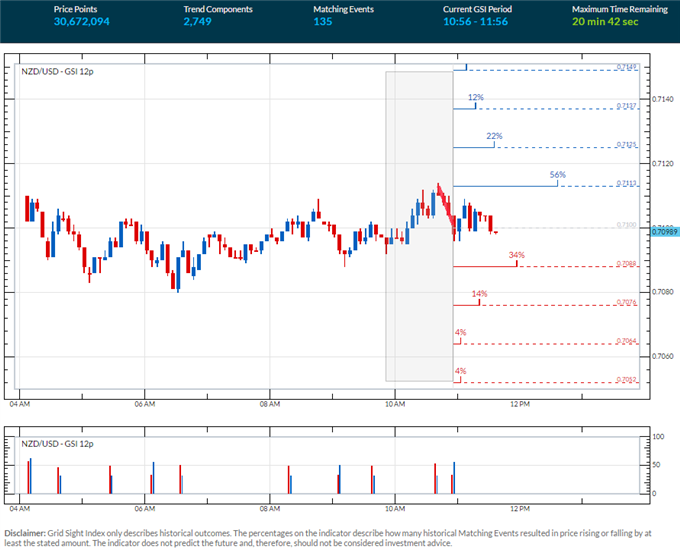
The NZD/USD has been pivoting around the 0.71 handle coming into European trading hours. The GSI indicator above is showing that similar momentum patterns in the past saw a move higher in 56% of the times. The GSI indicator calculates the distribution of past event outcomes given certain momentum patterns, and can give you a look at the market in a way that's never been possible before, analyzing millions of historical prices in real time. By matching events in the past, GSI describes how often the price moved in a certain direction.
You can learn more about the GSI here.
NZD/USD Technical Levels:

Click here for the DailyFX Support & Resistance tool
We use volatility measures as a way to better fit our strategy to market conditions. NZD/USD 1-week implied volatility is at 13.15 at the time of writing, which is 6.05% higher than yesterday. In turn, this may imply that breakout type trades are generally preferable today.
NZD/USD 30-Min Chart with SPX 500 Overlay: July 6, 2016
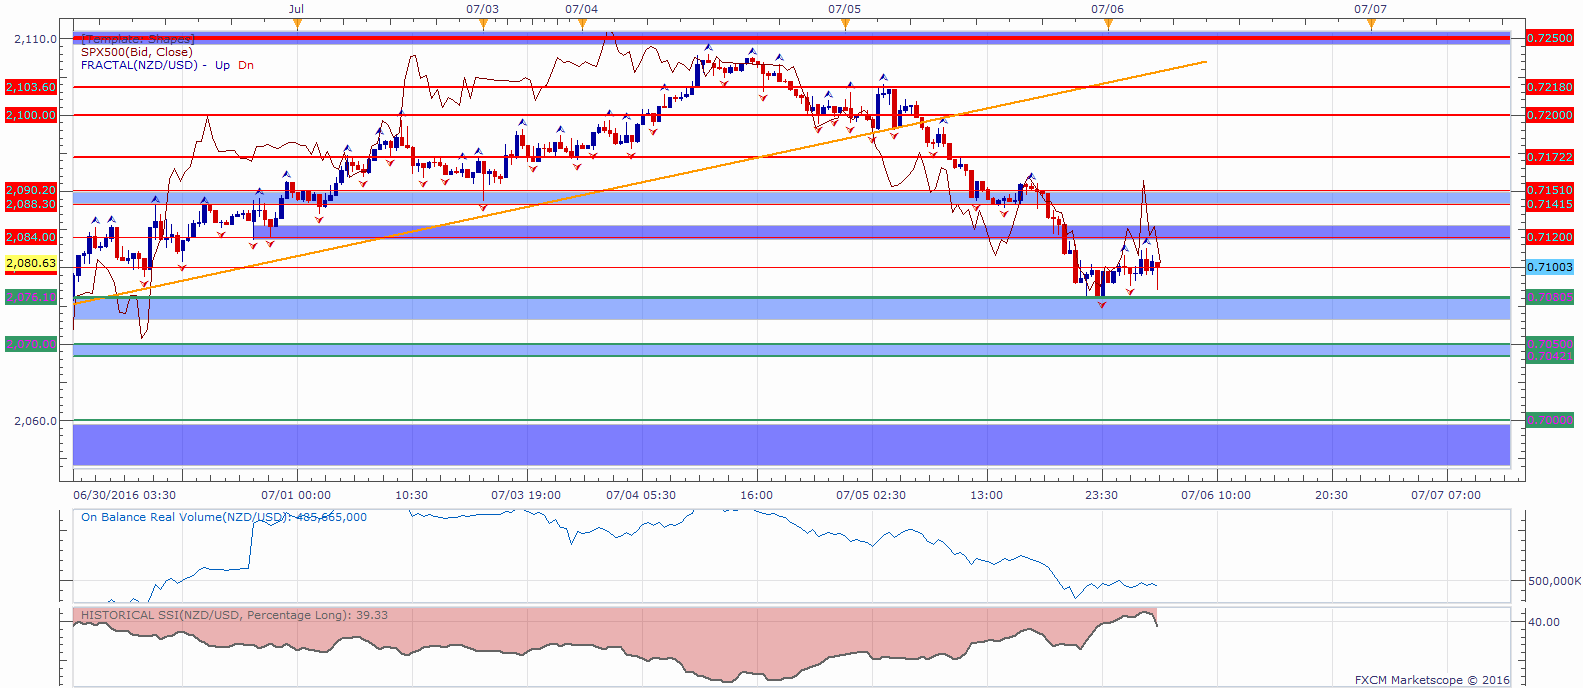
The NZD/USD is trading around the 0.71 handle after bouncing from support at around 0.7080. Further levels of support might be found at 0.7050 followed by what looks like a significant support area below the 0.70 handle.
Levels of potential resistance on a move higher may be 0.7120, an area around the 0.7150 figure, 0.7172 and the 0.72 handle.
When price reaches those levels, short term traders might use the GSI to view how prices reacted in the past given a certain momentum pattern, and see the distribution of historical outcomes in which the price reversed or continued in the same direction. We generally want to see GSI with the historical patterns significantly shifted in one direction, which could potentially be used with a pre-determined bias as well.
A common way to use GSI is to help you fade tops and bottoms, and trade breakouts. That’s why traders may want to use the GSI indicator when price reaches those specific pre-determined levels, and fit a strategy that can offer a proper way to define risk. We studied over 43 million real trades and found that traders who do that were three times more likely to turn a profit. Read more on the “Traits of Successful Traders” research.
Meanwhile, the DailyFX Speculative Sentiment Index (SSI) is showing thatabout 39.3% of traders are long the NZD/USD at the time of writing. Retail traders flipped net short June 1 as the pair traded higher, and added to shorts on the way up. The SSI is mainly used as a contrarian indicator, implying a possible strength ahead for the pair.
You can find more info about the DailyFX SSI indicator here
--- Written by Oded Shimoni, Junior Currency Analyst for DailyFX.com
To contact Oded Shimoni, e-mail oshimoni@dailyfx.com


