


Talking Points:
- EUR/USD is trading in the confines of a well-defined short term triangle post “Brexit”
- German CPI, US PCE and the European Council Meeting in focus today, but doubts remain on short term influence
The EUR/USD is trading sideways as the pair continues to fluctuate in perceived indecision following the “Brexit” vote. Indeed, long term implications for the Euro following the referendum appear significant, but with those implications still very unclear it seems that the pair might be in a “wait and see mode”, while short term technical signs are suggesting something may be brewing below the surface.
Looking ahead, German CPI and US PCE figures headline the economic calendar, and the second day of the European Council meeting could provide further news on “Brexit”. Question marks remain on short term market moving impact of economic indicators following the referendum, but caution might be warranted.
Taking this into consideration, we look to find short term trading opportunities using the Grid Sight Index (GSI) indicator.
Click Here for the DailyFX Calendar
The Second Day of the European Council Meeting is set to be held throughout the day. The first day saw some views expressed by the members of the council, but didn’t provide policy specifics, which could suggest reduced market moving influence today as well.
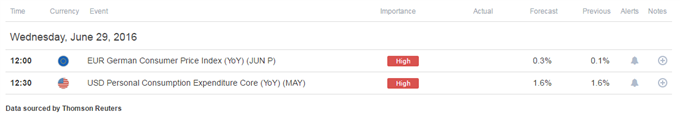
German Flash Consumer Price Index headlines the docket in European trading hours. The June year-on-year figure is expected to show an uptick to 0.3% from the prior 0.1%. The figure is key to understanding the current inflation pressures in the Euro-Zone’s largest economy, which is significant in the context of the ECB fighting deflationary pressures.
US May PCE figures are set to be released later as well. The core year-on-year print is expected to remain unchanged at 1.6%. The Fed uses a measure of inflation derived from the PCE as their primary gauge of inflation which makes this a key event risk to watch due to possible influence on monetary policy actions.
Both those economic indicators are of high significance for their implications to monetary policy, but it seems likely that monetary policy may be put to the side in this current trading environment, as risk trends take center stage in the aftermath of the “Brexit” decision. 10-day correlation between the EUR/USD and the SPX 500 currently stands at 94% after the US Dollar’s “safe haven” status appears to have been reignited following the decision.
With that said, the current “quiet” period in the pair as opposed to higher probabilities of volatile reactions because of the “Brexit” situations might make for ripe condition for significant price swings.
EUR/USD 5-Min GSI Chart: June 29, 2016
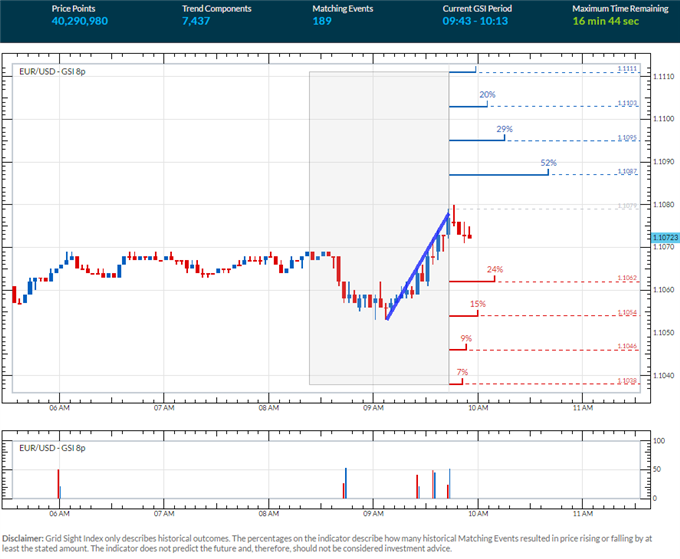
The EUR/USD is seeing some upside movement alongside SPX 500 futures, as we approach London open. The GSI indicator above shows that in 52% of similar past momentum patterns, the pair saw further positive momentum. The GSI indicator calculates the distribution of past event outcomes given certain momentum patterns, and can give you a look at the market in a way that's never been possible before, analyzing millions of historical prices in real time. By matching events in the past, GSI describes how often the price moved in a certain direction.
You can learn more about the GSI here.
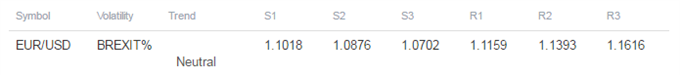
EUR/USD Technical Levels:
Click here for the DailyFX Support & Resistance tool
We use volatility measures as a way to better fit our strategy to market conditions. The current “quiet” period in the pair as opposed to higher probabilities of volatile reactions because of the “Brexit” situations might make for ripe condition for significant price swings. In turn, it may imply that breakout type trades are generally preferable in the short term.
EUR/USD 30-Min Chart with SPX 500 Overlay: June 29, 2016

The EUR/USD is attempting a break higher from a well-defined triangle congestion. While the pattern usually implies a continuation, a couple of technical signals pointed to the upside. First, notice how the SPX 500 continued to move to the upside while the EUR/USD traded slightly lower (with a 94% 10-day correlation). Second, the OBV showed more buying pressure than was being indicated in price action. Third, the GSI showed that past events saw continued momentum higher.
Follow through is the question now, and it might be limited as the macro picture may imply that a correction higher could see a continuation of the downtrend.
Near term resistance could be the 1.11 handle followed by a possible resistance zone around the 1.1150 level. A break above that area might put the spotlight on possible resistance levels above the 1.118 level.
Level of interest on a move lower could be the 1.1040 area, followed by the 1.10 handle, with possible support around “Brexit” lows at about 1.0928. The 1.09 handle and the 1.0886 level lurk below.
When price reaches those levels, short term traders might use the GSI to view how prices reacted in the past given a certain momentum pattern, and see the distribution of historical outcomes in which the price reversed or continued in the same direction. We generally want to see GSI with the historical patterns significantly shifted in one direction, which could potentially be used with a pre-determined bias as well.
A common way to use GSI is to help you fade tops and bottoms, and trade breakouts. That’s why traders may want to use the GSI indicator when price reaches those specific pre-determined levels, and fit a strategy that can offer a proper way to define risk. We studied over 43 million real trades and found that traders who do that were three times more likely to turn a profit. Read more on the “Traits of Successful Traders” research.
Meanwhile, the DailyFX Speculative Sentiment Index (SSI) is showing thatabout 45.4% of traders are long the EUR/USD at the time of writing. Retail traders flipped net short yesterday as the price turned higher, apparently trying to sell the pullback.
You can find more info about the DailyFX SSI indicator here
--- Written by Oded Shimoni, Junior Currency Analyst for DailyFX.com


