


Talking Points:
- USD/CAD trading around the 1.30 handle after correcting lower alongside a rise in equities
- US Final GDP figures and June’s Consumer Confidence might have reduced impact
The USD/CAD is trading around the 1.30 handle after the pair corrected lower alongside equities following two days of significant advances on the backdrop of the “Brexit” decision. The sentiment linked Canadian Dollar suffered while the safety linked US counterpart strengthened in the aftermath of the referendum, as “risk off” appeared to be the order of the day. With that being said, the pair is trading lower today as corrective price action may be in order.
Looking ahead, the US Final 1Q GDP figures and June’s Consumer Confidence headline the scheduled economic docket, but might have reduced influence today as the market continues to digest life after the “Brexit” decision, while the European Parliament “Brexit” resolution seems unlikely to generate any specifics on the UK’s departure.
Taking this into consideration, we look to find short term trading opportunities using the Grid Sight Index (GSI) indicator.
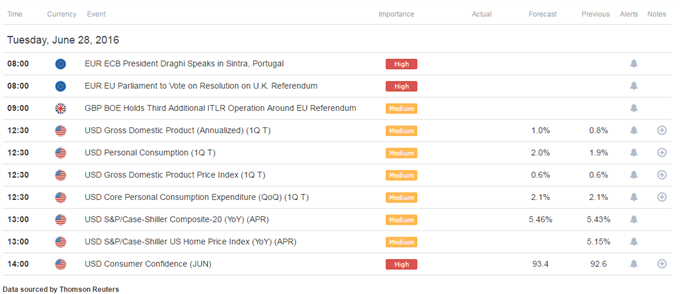
Click Here for the DailyFX Calendar
The upcoming European Parliament “Brexit” resolution seems unlikely to generate any specifics on the UK’s departure at the time being. This is a key event to monitor due to the sensitivity expected in the markets to any “Brexit” news, but it seems unlikely to generate significant surprises.
US 1Q Final GDP figures are set to be released later. The figures are expected to be revised higher again and show an annual growth rate of 1.0% in Q1 versus a 0.8% prior print, as Personal Consumption is expected to uptick.
The market is set to get a fresh reading of consumer trends in the US, as the June’s Consumer Confidence figures are released 17:00 GMT. The survey is expected to show an improvement to 93.4 from the prior 92.6 figure, which could provide a sign of strength in the US economy.
With that said, economic indicators might have reduced impact in the days ahead before the market assesses the “Brexit” implications. In turn, “risk trends” could be the main market driver for the moment.
A correction higher is “risky assets” could see positivity from the Canadian Dollar, while another burst of negativity in global sentiment may bode ill for the sentiment linked currency, but boost its US counterpart. USD/CAD 10-day correlation to the SPX 500 and Crude Oil is -0.86 and -0.89 respectively at the time of writing, further strengthening the case illustrated above.
USD/CAD 5-Min GSI Chart: June 28, 2016
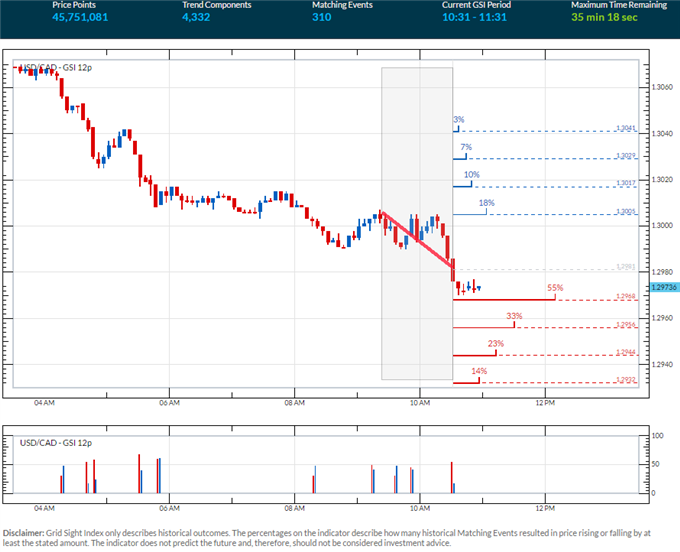
The USD/CAD has broken support at the 1.30 handle at the time of writing after a corrective move lower alongside higher “risky assets”. The GSI indicator above shows that in 55% of similar past momentum patterns, the pair saw further downside momentum. The GSI indicator calculates the distribution of past event outcomes given certain momentum patterns, and can give you a look at the market in a way that's never been possible before, analyzing millions of historical prices in real time. By matching events in the past, GSI describes how often the price moved in a certain direction.
You can learn more about the GSI here.
USD/CAD Technical Levels:
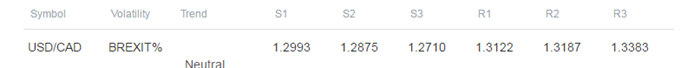
Click here for the DailyFX Support & Resistance tool
We use volatility measures as a way to better fit our strategy to market conditions. The Index of implied 3-month volatility readings for the majors jumped by more than 20% following the “Brexit” decision. The market seems likely to be highly sensitive to incoming information on the decision’s implications. In turn, it may imply that breakout type trades are generally preferable in the short term. However, if the market continues to be in digestion mode, technical levels might hold.
USD/CAD 30-Min Chart with Crude Oil Overlay: June 28, 2016

The USD/CAD is trading near possible support at 1.2960 at the time of writing. Other levels of interest on a move lower might be the 1.2930 followed by the 1.2900 handle. A break below the level might put the spotlight on a possible support area below 1.2867.
Level of interest on a move higher could be the 1.30 handle followed by possible resistance at 1.3053, and the 1.31 handle above.
When price reaches those levels, short term traders might use the GSI to view how prices reacted in the past given a certain momentum pattern, and see the distribution of historical outcomes in which the price reversed or continued in the same direction. We generally want to see GSI with the historical patterns significantly shifted in one direction, which could potentially be used with a pre-determined bias as well.
A common way to use GSI is to help you fade tops and bottoms, and trade breakouts. That’s why traders may want to use the GSI indicator when price reaches those specific pre-determined levels, and fit a strategy that can offer a proper way to define risk. We studied over 43 million real trades and found that traders who do that were three times more likely to turn a profit. Read more on the “Traits of Successful Traders” research.
Meanwhile, the DailyFX Speculative Sentiment Index (SSI) is showing that about 54.1% of traders are long the USD/CAD at the time of writing. Retail traders flipped net long yesterday as the price turned lower, apparently trying to buy the pullback.
The SSI is mainly used as a contrarian indicator, implying a further weakness ahead for the pair.
You can find more info about the DailyFX SSI indicator here
--- Written by Oded Shimoni, Junior Currency Analyst for DailyFX.com


