


Talking Points:
- AUD/USD appears to have found support around the 0.73 handle after the “Brexit” decision
- US Markit PMIs and the Advance Goods Trade Balance figure appear likely to be brushed off
The AUD/USD is pivoting around the 0.74 handle after the pair saw a massive decline (approximately 330 pips) on the backdrop of the “Brexit” decision. The sentiment linked Australian Dollar suffered while the safety linked US counterpart strengthened in the aftermath of the referendum, as “risk off” appeared to be the order of the day.
With that being said, the pair looks like it found some support around the 0.73 handle following the sharp decline, and is now trading sideways as a “Brexit hangover” seems to take place.
Looking ahead, US Markit PMIs and the Advance Goods Trade Balance headline the scheduled economic docket, but it appears likely that the figures won’t have significant influence today as the market continues to digest life after the “Brexit” decision.
Taking this into consideration, we look to find short term trading opportunities using the Grid Sight Index (GSI) indicator.
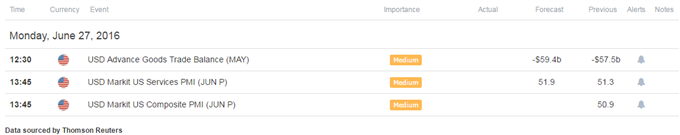
Click Here for the DailyFX Calendar
US Advance Goods Trade Balance is set to hit the wires at 12:30 GMT. The print is expected to show a -59.4b deficit versus a -57.5b prior print.
US Markit PMIs are on the docket as well. The diffusion index compiled by Markit economics is expected to register an improvement to 51.9 in the Services sector from the prior 51.3 print. A reading of less than 50 indicates a contraction of activity, above 50 points to an expansion, and an index of 50 says that no change has occurred.
With the said, the scheduled event risk on the docket looks unlikely to generate any significant response by a market that seems completely consumed with “Brexit” uncertainties. The upcoming ECB forum in Portugal could produce some commentary on the referendum, but “risk trends” seem likely be the main driver for the moment unless some policy specific details come up.
A correction higher in “risky assets” could see positivity from the Aussie, while another burst of negativity in global sentiment may bode ill for the sentiment linked currency, but boost the US Dollar.
AUD/USD 3-Min GSI Chart: June 27, 2016
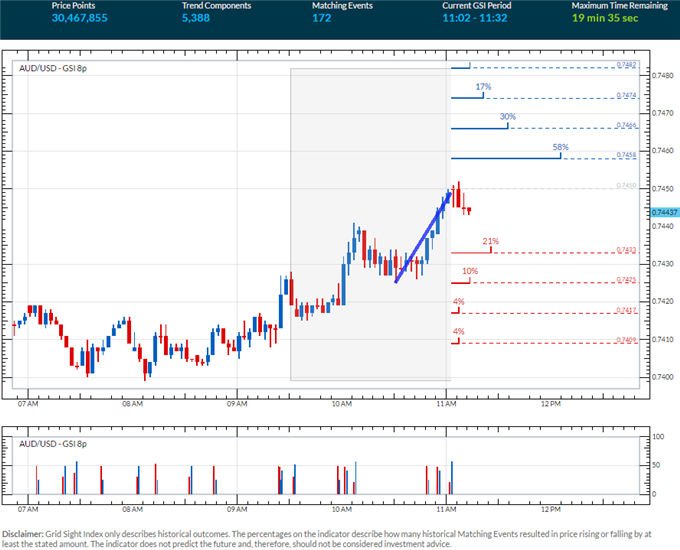
The AUD/USD is trading at resistance at 0.7450 at the time of writing (see chart below) after a corrective move higher alongside “risky assets”. Interestingly, the GSI indicator above shows that in 58% of similar past momentum patterns, the pair traded higher by 8 pips and 16 pips higher 30% of past events. The GSI indicator calculates the distribution of past event outcomes given certain momentum patterns, and can give you a look at the market in a way that's never been possible before, analyzing millions of historical prices in real time. By matching events in the past, GSI describes how often the price moved in a certain direction.
You can learn more about the GSI here.
AUD/USD Technical Levels:
Click here for the DailyFX Support & Resistance tool
We use volatility measures as a way to better fit our strategy to market conditions. The Index of implied 3-month volatility readings for the majors jumped by more than 20% following the “Brexit” decision. The market seems likely to be highly sensitive to incoming information on the decision’s implications. In turn, it may imply that breakout type trades are generally preferable in the short term. However, if the market continues to be in digestion mode, technical levels might hold.
AUD/USD 30-Min Chart with SPX 500 Overlay: June 27, 2016

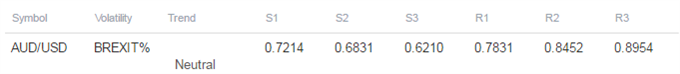
The AUD/USD is trading at resistance at 0.7450 at the time of writing. Other levels of interest on a move higher might be the 0.75 handle followed by a possible resistance zone around the 0.7550 figure. The 0.76 handle lurks above.
Level of interest on a move lower could be the 0.74 handle followed by possible short term support levels at 0.7386, and 0.7360, with a support area around the 0.73 handle below. The 0.7250 level might prove significant on a push lower.
When price reaches those levels, short term traders might use the GSI to view how prices reacted in the past given a certain momentum pattern, and see the distribution of historical outcomes in which the price reversed or continued in the same direction. We generally want to see GSI with the historical patterns significantly shifted in one direction, which could potentially be used with a pre-determined bias as well.
A common way to use GSI is to help you fade tops and bottoms, and trade breakouts. That’s why traders may want to use the GSI indicator when price reaches those specific pre-determined levels, and fit a strategy that can offer a proper way to define risk. We studied over 43 million real trades and found that traders who do that were three times more likely to turn a profit. Read more on the “Traits of Successful Traders” research.
Meanwhile, the DailyFX Speculative Sentiment Index (SSI) is showing that about 54.0% of traders are long the AUD/USD at the time of writing. Retail traders flipped net long during the sharp move lower, apparently trying to pick a bottom (see the “Traits of Successful Traders” research).
The SSI is mainly used as a contrarian indicator, implying a further weakness ahead for the pair.
You can find more info about the DailyFX SSI indicator here
--- Written by Oded Shimoni, Junior Currency Analyst for DailyFX.com


