


Talking Points:
- USD/CAD correcting alongside risk assets after a surge higher earlier this week
- Sideways movement may prevail today if “Brexit” jitters subside
The USD/CAD is trading lower after a surge higher earlier this week, which seemed to follow a “risk assets” sell off. However, the sentiment linked Canadian Dollar seems to strengthen versus its US counterpart on higher share prices at the moment, alongside the Euro and the British Pound, emphasizing the focus on “Brexit” for the time being.
Interestingly, Crude Oil prices didn’t seem to follow the bounce in risk assets yesterday, which could potentially cap Canadian Dollar gains. 10-day correlation between USD/CAD and Crude Oil stands at a substantial -0.97, which could imply that further Canadian Dollar gains might need to see a rise in Oil prices.
US building permits and Canada Consumer Price Index headline the economic calendar, but could have limited affect as market focus seems completely turned to next week’s EU referendum and the possibility of a “Brexit” scenario.
Taking this into consideration, we look to find short term trading opportunities using the Grid Sight Index (GSI) indicator.

Click Here for the DailyFX Calendar
US Housing Starts is expected to print a month-on-month -1.9% easing from the prior +4.9% figure. However, the more timely US Building Permits number is expected to show a rise of 1.3% month-on-month increase in May, with a 4.9% prior print.
The Canada Consumer Price Index is also on the docket. Headline CPI is set to print an easing to 1.6% year-on-year from the prior 1.7% figure, while the core figure is expected to downtick as well.
The weekly Baker Hughes rig count could have a say as well for the pair, but as mentioned, the events on the docket could have limited impact today as the market appears to be in correction mode ahead of next week, as “Brexit” fears make their way to global risk trends.
USD/CAD 5-Min GSI Chart: June 17, 2016

The USD/CAD moved lower by about 25 pips on London open, and the GSI indicator above shows that in 55% of similar past events, the pair continued to trade lower by 8 pips. The GSI indicator calculates the distribution of past event outcomes given certain momentum patterns, and can give you a look at the market in a way that's never been possible before, analyzing millions of historical prices in real time. By matching events in the past, GSI describes how often the price moved in a certain direction.
You can learn more about the GSI here.
USD/CAD Technical Levels:

Click here for the DailyFX Support & Resistance tool
We use volatility measures as a way to better fit our strategy to market conditions. CVIX gauge of one-month implied FX volatility has surged to the highest level since 2011 on the backdrop of the upcoming EU referendum. This might help to explain the volatility bursts as of late. In turn, it may imply that breakout type trades are preferable in the short term. With that being said, given the aforementioned considerations, today might see sideways movement for the pair in which technical levels may hold while Crude Oil could potentially cap Canadian Dollar gains.
USD/CAD 30-Min Chart With Crude Oil Overlay: June 17, 2016
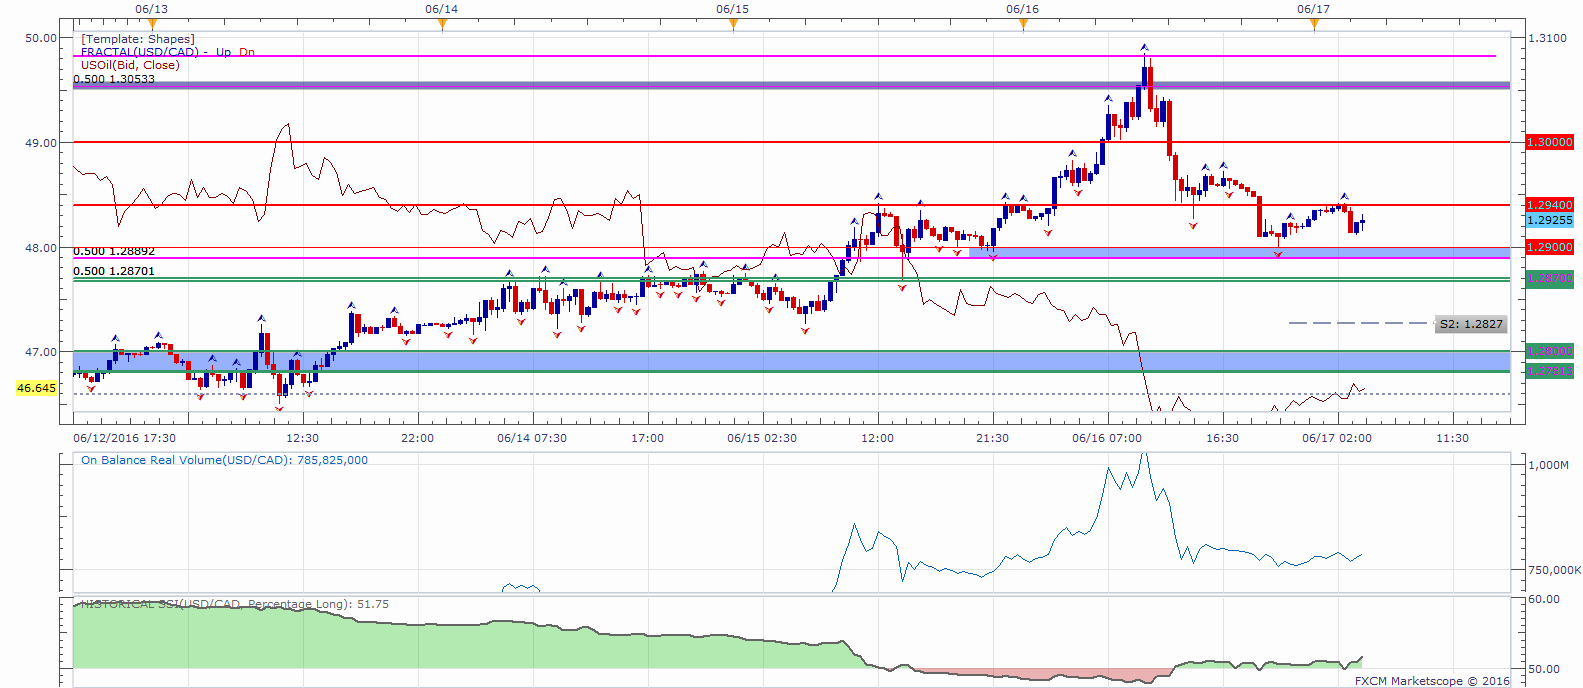
The USD/CAD is trading below possible resistance at 1.2940. Other levels of interest on a move higher might be the 1.30 handle followed by possible resistance around 1.3050 and 1.3082.
Level of interest on a move lower could be a possible support zone below the 1.29 handle followed by 1.2870, 1.2827 and a support zone between 1.2800-1.2780. Another prior support sits below at 1.2760.
When price reaches those levels, short term traders might use the GSI to view how prices reacted in the past given a certain momentum pattern, and see the distribution of historical outcomes in which the price reversed or continued in the same direction. We generally want to see GSI with the historical patterns significantly shifted in one direction, which could potentially be used with a pre-determined bias as well.
A common way to use GSI is to help you fade tops and bottoms, and trade breakouts. That’s why traders may want to use the GSI indicator when price reaches those specific pre-determined levels, and fit a strategy that can offer a proper way to define risk. We studied over 43 million real trades and found that traders who do that were three times more likely to turn a profit. Read more on the “Traits of Successful Traders” research.
Meanwhile, the DailyFX Speculative Sentiment Index (SSI) is showing that about 51.74% of traders are long the USD/CAD at the time of writing. The SSI is mainly used as a contrarian indicator, implying a slight short bias for the pair.
You can find more info about the DailyFX SSI indicator here
--- Written by Oded Shimoni, Junior Currency Analyst for DailyFX.com


