


Talking Points:
- GBP/USD currently trades below the 1.42 handle swinging intraday inside a 200 pip range
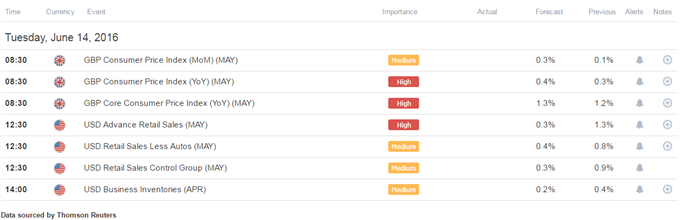
- UK CPI and US Retail Sales headline today’s economic calendar, but could have limited impact
The GBP/USD currently trades below the 1.42 handle (at the time this report was written) as the pair continues to fluctuate aggressively around “Brexit” polls inside a 200 pip range since the start of the week.
UK CPI and US Retail Sales headline today’s economic calendar but may have less impact than “normal” conditions as the pair appears to move in anticipation of the EU Referendum and tomorrow’s FOMC rate decision.
Taking this into consideration, we look to find short term trading opportunities using the Grid Sight Index (GSI) indicator.
Click Here for the DailyFX Calendar
UK CPI figures are in focus in European trading hours. The headline year-on-year figure is expected to print an uptick to 0.4% versus a prior 0.3% figure. Core inflation is set to improve as well, hitting 1.3% versus a prior 1.2% print. In “normal” trading conditions, an uptick in CPI figures might be seen as supportive for BoE tightening bets, but the market appears highly focused on “Brexit” concerns at the moment, which could imply that the figures may have limited follow-through, unless a significant deviation from expectations hit the wires. Indeed, we saw different polls this past Friday, Monday and early Tuesday that sent the British Pound trading in an erratic fashion.
US Retail Sales figures might find reduced reaction by the market, as participants could potentially hold back in anticipation of the FOMC Rate Decision tomorrow, and the new Fed projections. Receipts are expected to see an addition of 0.3% versus a 1.3% prior print.
GBP/USD 5-Min GSI Chart: June 14, 2016
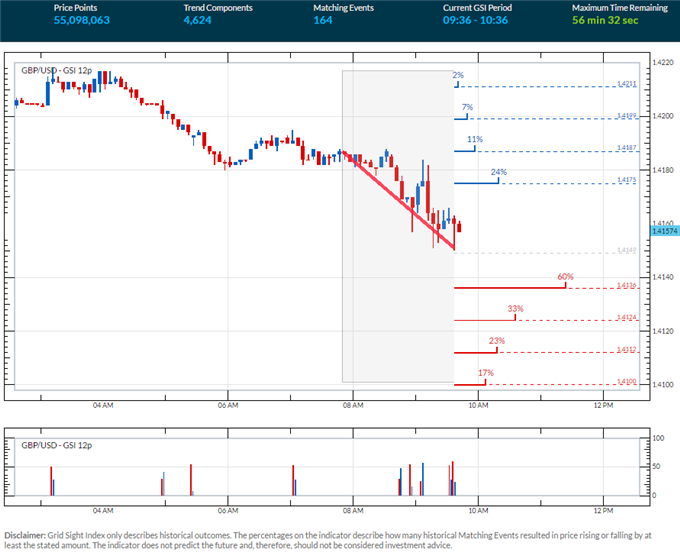
The GBP/USD is edging lower at the time of writing. The GSI indicator above shows that in 60% of similar past events, the pair traded lower by 13 pips, and 23% of the events saw a drop of 37 pips.
The GSI indicator calculates the distribution of past event outcomes given certain momentum patterns, and can give you a look at the market in a way that's never been possible before, analyzing millions of historical prices in real time. By matching events in the past, GSI describes how often the price moved in a certain direction.
You can learn more about the GSI here.
GBP/USD Technical Levels:

Click here for the DailyFX Support & Resistance tool
We use volatility measures as a way to better fit our strategy to market conditions. On the backdrop of the upcoming EU Referendum, the British Pound 2 week implied volatility has surged to levels comparable only to the great financial crisis, with a difference of about 27 percentage points between implied and actual volatility. This makes for trading conditions that might require a very short term, carful tactical approach. In turn, this could imply that breakout type trades are preferable in the short term. The pair appears to trade in a wide intra-day range of about 200 pips at the time of writing.
GBP/USD 30-Min Chart: June 14, 2016

The GBP/USD is trading at a key support zone around 1.4130 which defines the bottom part of a 200 pip trading range since the start of the week.
If the pair manages to break below, this might expose a possible support zone below 1.4078 to 1.4050, followed by the 1.40 handle, and a possible support at around 1.3950, with the 1.39 handle lurking below.
Levels of interest on a move higher may be the 1.42 handle, followed by a resistance zone at around 1.4250, and resistance at 1.4279. The 1.43 handle sits just above with a resistance zone around 1.4339 defining a range top.
When price reaches those levels, short term traders might use the GSI to view how prices reacted in the past given a certain momentum pattern, and see the distribution of historical outcomes in which the price reversed or continued in the same direction. We generally want to see GSI with the historical patterns significantly shifted in one direction, which could potentially be used with a pre-determined bias as well.
A common way to use GSI is to help you fade tops and bottoms, and trade breakouts. That’s why traders may want to use the GSI indicator when price reaches those specific pre-determined levels, and fit a strategy that can offer a proper way to define risk. We studied over 43 million real trades and found that traders who do that were three times more likely to turn a profit. Read more on the “Traits of Successful Traders” research.
Meanwhile, the DailyFX Speculative Sentiment Index (SSI) is showing thatabout 65.6% of traders are long the GBP/USD at the time of writing, suggesting that traders might be trying to pick the bottom of the intraday range in the pair. The SSI is mainly used as a contrarian indicator, implying further weakness ahead.
You can find more info about the DailyFX SSI indicator here
--- Written by Oded Shimoni, Junior Currency Analyst for DailyFX.com


