


Talking Points:
- AUD/USD currently trades slightly above 0.7400 after selling off from the 0.7500 handle
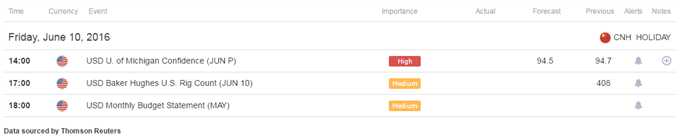
- June’s University of Michigan Confidence gauge might have little impact on an otherwise quiet economic calendar
The AUD/USD currently trades slightly above 0.7400 (at the time this report was written) as the pair sold off from the 0.7500 handle after rallying to the level on RBA’s rate decision, in which the central bank opted to keep policy at status quo. The move to the downside appeared to be on the backdrop of a general “risk off” environment yesterday which saw a move lower on stocks and Crude Oil. The sentiment linked Australian Dollar declined while its US Counterpart gained.
It seems like risk on/off dynamic could take center stage again today, and indeed the 10-day correlation between the AUD/USD and the SPX 500 is an impressive 0.85 at the time of writing. The University of Michigan Confidence figure is a major US scheduled event risk on the docket, and could perhaps provide the last chance for a shift in diminishing Fed rate hike expectations.
Taking this into consideration, we look to find short term trading opportunities using the Grid Sight Index (GSI) indicator.
Click Here for the DailyFX Calendar
The University of Michigan Confidence survey takes the spotlight in US trading hours today. The Survey assesses consumer confidence based on hundreds of telephone surveys, and might provide the last chance for the market to change Fed rate hike bets (perhaps on higher inflation expectations) before next week’s FOMC policy announcement. With that being said, against this same backdrop the survey could have limited impact as market participants hold back before the major event risk next week.
AUD/USD 5-Min GSI Chart: June 10, 2016

The AUD/USD is trading sideways at the time of writing, but volatility might pick up after London open. The GSI indicator above calculates the distribution of past event outcomes given certain momentum patterns, and can give you a look at the market in a way that's never been possible before, analyzing millions of historical prices in real time. By matching events in the past, GSI describes how often the price moved in a certain direction.
You can learn more about the GSI here.
AUD/USD Technical Levels:

Click here for the DailyFX Support & Resistance tool
We use volatility measures as a way to better fit our strategy to market conditions. The AUD/USD 1-week implied volatility sits at 12.09 at the time of writing, which is 4.18% higher than yesterday. This could suggest that volatility may pick up in the days ahead, which might imply that breakout type trades are preferable in the short term. With that said, if the market stays in “digestion mode” on prepositioning ahead of the FOMC next week, traders may be able to play off short term technical levels.
As mentioned before traders might need to keep close tabs on risk assets movements, like the SPX 500, which could potentially be a major theme today for the pair.
AUD/USD 30-Min Chart With SPX 500 Overlay: June 10, 2016

The AUD/USD is trading just above a support zone at 0.7410-0.7400.
Other levels of support on a move lower might be found at 0.7383, followed by a support zone around 0.7360, and another zone at 0.7320-0.7310.
Levels of interest on a move higher may be 0.7450, followed by 0.7464 and what appears to be a very significant well defined long term resistance level at 0.7500. If the pair manages to break above that level, 0.7530 might be of interest as well.
When price reaches those levels, short term traders might use the GSI to view how prices reacted in the past given a certain momentum pattern, and see the distribution of historical outcomes in which the price reversed or continued in the same direction.
A common way to use GSI is to help you fade tops and bottoms, and trade breakouts. That’s why traders may want to use the GSI indicator when price reaches those specific pre-determined levels, and fit a strategy that might offer a proper way to define risk.
Meanwhile, the DailyFX Speculative Sentiment Index (SSI) is showing that about 52.32% of traders are long the AUD/USD at the time of writing, after “flipping” long yesterday. This might indicate that retail traders are trying to buy the pullback in the pair. The SSI is mainly used as a contrarian indicator, implying further weakness ahead.
You can find more info about the DailyFX SSI indicator here
--- Written by Oded Shimoni, Junior Currency Analyst for DailyFX.com


