


Talking Points:
- USD/CAD currently trades below 1.2800 after breaking down yesterday
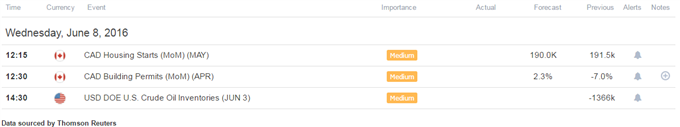
- A quiet economic calendar might put the focus on the Canadian housing data and Crude Oil Inventories
The USD/CAD currently trades below 1.2800 (at the time this report was written) after the pair broke down yesterday as SPX and Crude Oil posted 2016 highs. The Canadian Dollar might find similar fortunes today if optimism carries forward, as it seems focus may be put on Canada’s Building Permits and Housing Starts figures with Crude Oil Inventories data a bit later.
An otherwise quiet economic calendar might indicate that technical levels could hold as we look to find short term trading opportunities using the Grid Sight Index (GSI) indicator.
Click Here for the DailyFX Calendar
Canada Housing Starts and Building Permits are set to hit the wires in US trading hours. The month-on-month housing starts measure is expected to print an annualized 190.0k figure of new residential buildings versus a prior print of 191.5k figure. The Building Permits figure is expected to print a rise of 2.3% versus a prior -7.0% decline.
Higher than expected readings may offer a boost to the Canadian Dollar and might have implications for the more market moving Canadian job figures this Friday (As more construction could imply various jobs were created).
The Crude Oil Inventories later today may spur volatility for the pair. We will look to see the market’s reactions to the change from the prior -1366K print. 10-day correlation between USD/CAD and Crude Oil stands at an impressive -0.82 at the time of writing, with the SPX 500 correlation at -0.72. Indeed stocks and Crude Oil seem to move in tandem at the moment, and a positive reaction by oil and stocks today may imply further weakness for the USD/CAD.
USD/CAD 5-Min GSI Chart: June 8, 2016
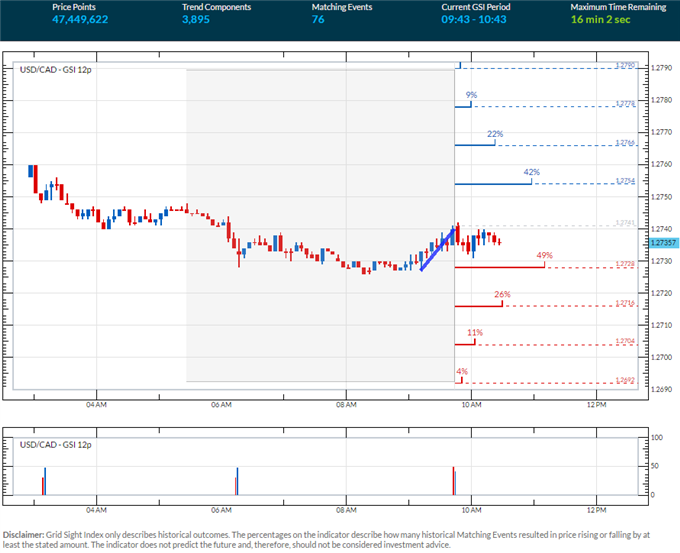
Sideways movement appears to prevail in the pair at the time of writing, perhaps on the backdrop of the quiet economic calendar. The GSI indicator above calculates the distribution of past event outcomes given certain momentum patterns, and can give you a look at the market in a way that's never been possible before, analyzing millions of historical prices in real time. By matching events in the past, GSI describes how often the price moved in a certain direction.
You can learn more about the GSI here.
USD/CAD Technical Levels:

Click here for the DailyFX Support & Resistance tool
We use volatility measures as a way to better fit our strategy to market conditions. Neutral perceived trading conditions might imply that technical levels could hold in today’s trade, with the aforementioned event risk as a possible invalidation of that bias for a shift to breakout type trades.
USD/CAD 30-Min Chart: June 8, 2016

The USD/CAD is trading below interim support turned resistance at 1.2759. Other levels of interest on a move higher may be 1.2780, followed by the 1.2800 handle and 1.2841, with a resistance zone lurking above at around 1.2852.
Support might be found at the 1.2700 handle, followed by a support zone at 1.2650-1.2623.
When price reaches those levels, short term traders might use the GSI to view how prices reacted in the past given a certain momentum pattern, and see the distribution of historical outcomes in which the price reversed or continued in the same direction.
A common way to use GSI is to help you fade tops and bottoms, and trade breakouts. That’s why traders may want to use the GSI indicator when price reaches those specific pre-determined levels, and fit a strategy that might offer a proper way to define risk.
Meanwhile, the DailyFX Speculative Sentiment Index (SSI) is showing that about 61.5% of traders are long the USD/CAD at the time of writing. The SSI is mainly used as a contrarian indicator, implying further weakness ahead for the pair.
You can find more info about the DailyFX SSI indicator here
--- Written by Oded Shimoni, Junior Currency Analyst for DailyFX.com


