


Talking Points:
- EUR/USD currently trades above 1.1350 as sideways movement prevails in early trade
- Fed Chair Yellen speech in Philadelphia in high focus
The EUR/USD currently trades above 1.1350 (at the time this report was written) as the pair seems to be treading water after the US Non-farm Payrolls surge this past Friday. A relatively quiet economic calendar in European trading hours might mean that technical levels could hold as we look to find short term trading opportunities using the Grid Sight Index (GSI) indicator, with the Yellen speech in focus later today.
Click Here for the DailyFX Calendar
The latest ECB meeting this past Thursday seemed to confirm that the central bank is in “implementation mode”, as certain elements of the easing measures the bank announced in March have yet to take place. In turn, this could see near term data from the Euro-Zone as having limited impact on the currency, with other macro themes taking center stage.
Indeed, after The US Non-farm Payrolls crushed US June rate hike expectations the Euro surged higher versus the US Dollar, and market focus now seems to be on the Janet Yellen speech in Philadelphia to see how she views the latest abysmal NFP report, and possible implications for the future rates path. The EUR/USD might continue to fluctuate side-ways until the event takes place.
EUR/USD 5-Min GSI Chart: June 6, 2016
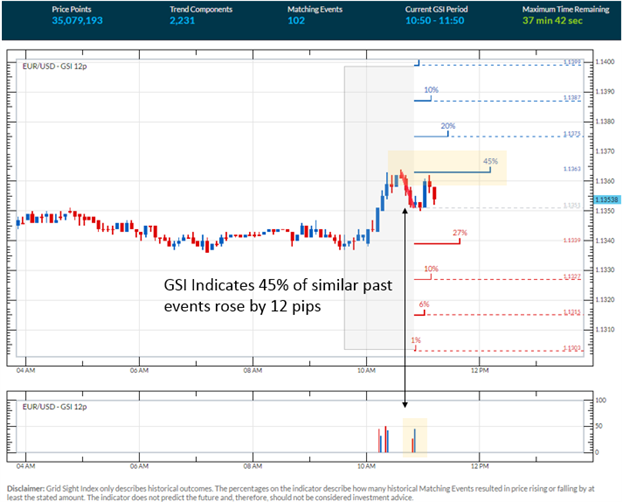
GSI is a powerful big data indicator that can give you a look at the market in a way that's never been possible before, analyzing millions of historical prices in real time. By matching events in the past, GSI describes how often the price moved in a certain direction.
You can learn more about the GSI here.
EUR/USD Technical Levels:

Click here for the DailyFX Support & Resistance tool
We use volatility measures as a way to better fit our strategy to market conditions. EUR/USD implied 1-weak volatility measures is 8.13 at the time of writing, which is the lowest implied volatility for a Euro based pair, except for the EUR/CHF. Taking this into consideration as well, might mean that technical levels are likely to hold. With that being said, volatility may pick up following the Yellen speech in Philadelphia, which could imply that traders should be on the lookout for breakout trades later today.
EUR/USD 30-Min Chart: June 6, 2016

The EUR/USD is pivoting around support at 1.1350. Other levels of interest on a move lower may be 1.13217, followed by the 1.1300 handle and a support zone around 1.1280.
Immediate resistance might be found at 1.1370, followed by the 1.1400 handle, and a very significant resistance zone around 1.4300. If the price breaks above that zone, the pair may find further resistance at around 1.1467.
A common way to use GSI is to help you fade tops and bottoms, and trade breakouts. That’s why traders may want to use the GSI indicator when price reaches those specific pre-determined levels, and fit a strategy that might offer a proper way to define risk.
When price reaches those levels, short term traders could use the GSI to view how prices reacted in the past given a certain momentum pattern, and see the distribution of historical outcomes in which the price reversed or continued in the same direction.
Meanwhile, the DailyFX Speculative Sentiment Index (SSI) is showing that about 40.5% of traders are long the EUR/USD at the time of writing. The SSI is mainly used as a contrarian indicator, implying further strength ahead for the EUR/USD.
You can find more info about the DailyFX SSI indicator here
--- Written by Oded Shimoni, DailyFX Research


