


What’s inside:
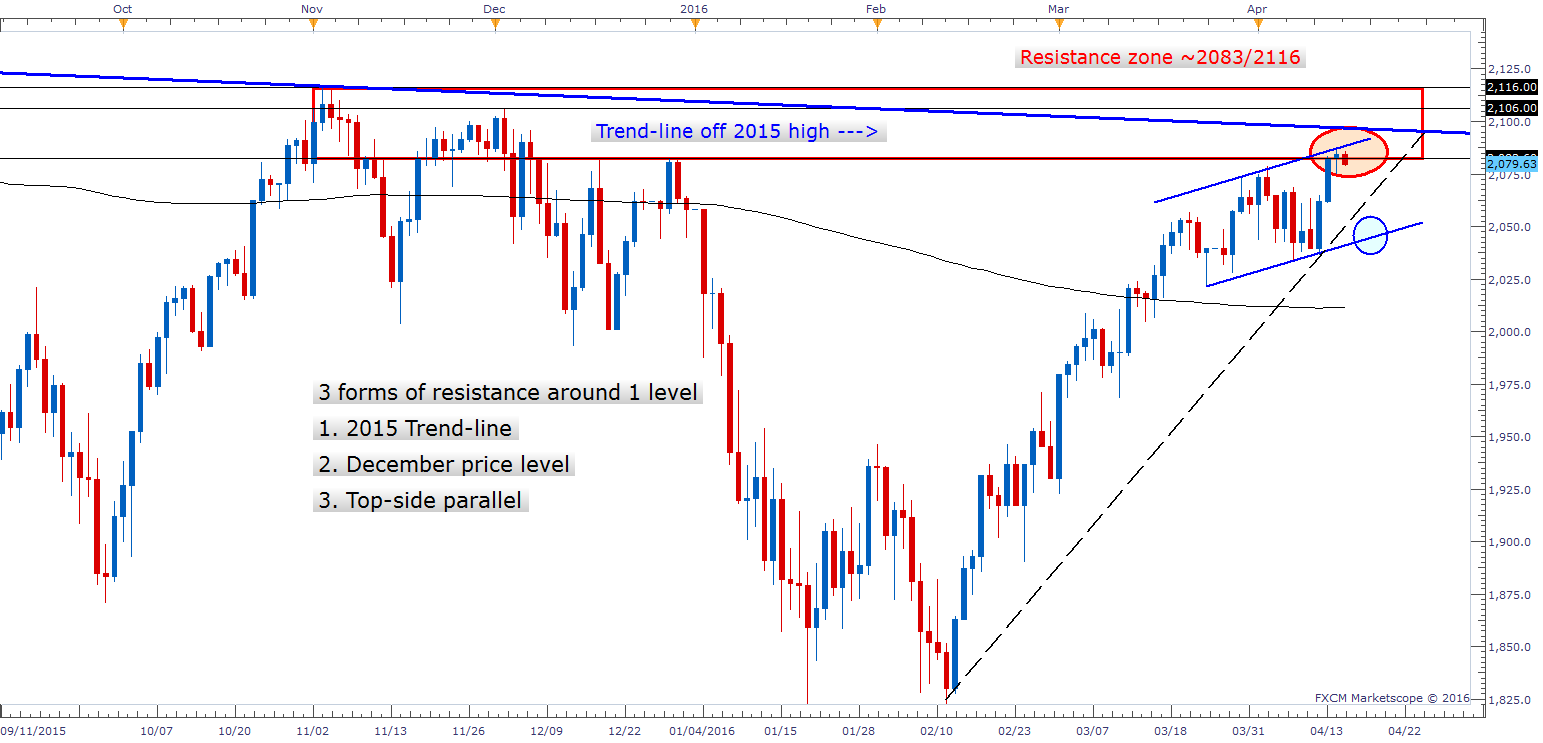
- S&P 500 has three forms of resistance near one price level
- Dow trades just shy of 18000
- Next ‘big’ swing trade looks lower, but still taking it one day at a time
The S&P 500 (FXCM:SPX500) is trading at a critical juncture, consisting of near intersecting lines of resistance. To recap from yesterday’s article, the intersection consists of the May 2015 trend-line (just a little higher around 2095ish), horizontal resistance from December (2083), and the top-side parallel of a developing rising channel (2086ish).
The Dow (FXCM:US30) is right in the thick of it, with sizable resistance right on the tip of its nose just shy of 18000. It's not just a psychological level, but an 'actual' level which put in place a peak late last year.
The current picture tilts the bias to the down-side, but doesn't necessarily mean we will see aggressive selling. At least not just yet. The lower parallel in the S&P is one potential target, but recent history suggests buyers will put up a fight, so we may see a shallow dip before attempting to make another higher high into resistance. It's possible the market finds a bid off a line running from the Feb 11 low, but not much weight is put into that as trend support at this time.
SPX500 Daily: Oct '15 to Present
The next 'big' swing trade looks likely to be to the downside. We appear to be near a turning point in terms of price, but as stated yesterday it could take a little time before buyers become fully exhausted. It's a bit of a tricky spot right here; the trend remains pointed higher, but resistance of serious implications stands in the market's way. Until we see a clear break in the trend, though, the focus continues to be on trades with short-term trade durations in both directions lasting a day or two.
Find out what separates consistently profitable traders from the rest in our guide, “Traits of Successful Traders”.
---Written by Paul Robinson, Market Analyst
You can follow Paul on Twitter @PaulRobinsonFX, or email him directly at instructor@dailyfx.com.


