


What's inside:
- Short-term technical structure and levels ahead of NFP
- More of the same from a broader standpoint
- A move to 2080/100 in the S&P 500 would be a welcomed event
Yesterday’s price action in the indices was much muted ahead of today’s NFP fiasco, only leaving opportunity for the nimble day-trader. We noted the 2055 area in the S&P 500 as holding yesterday early morning after probing it in overnight trade. It provided support for a bounce higher in the morning, but in the afternoon sellers came in and the S&P moved lower back into noted support, only to break it in overnight trade, landing it on a lower parallel near 2050. The S&P is getting rejected from a retest of broken support surrounding 2055 at the time of this writing; that level matters.
In the short-run: the lower parallel/Mar 28 pivot at 2049/50 acts as support, while 2055, the upper parallel around 2062, 2067, and 2073 will act as resistance. These will be the numbers we operate off of heading into today’s jobs report.
S&P 500 Hourly

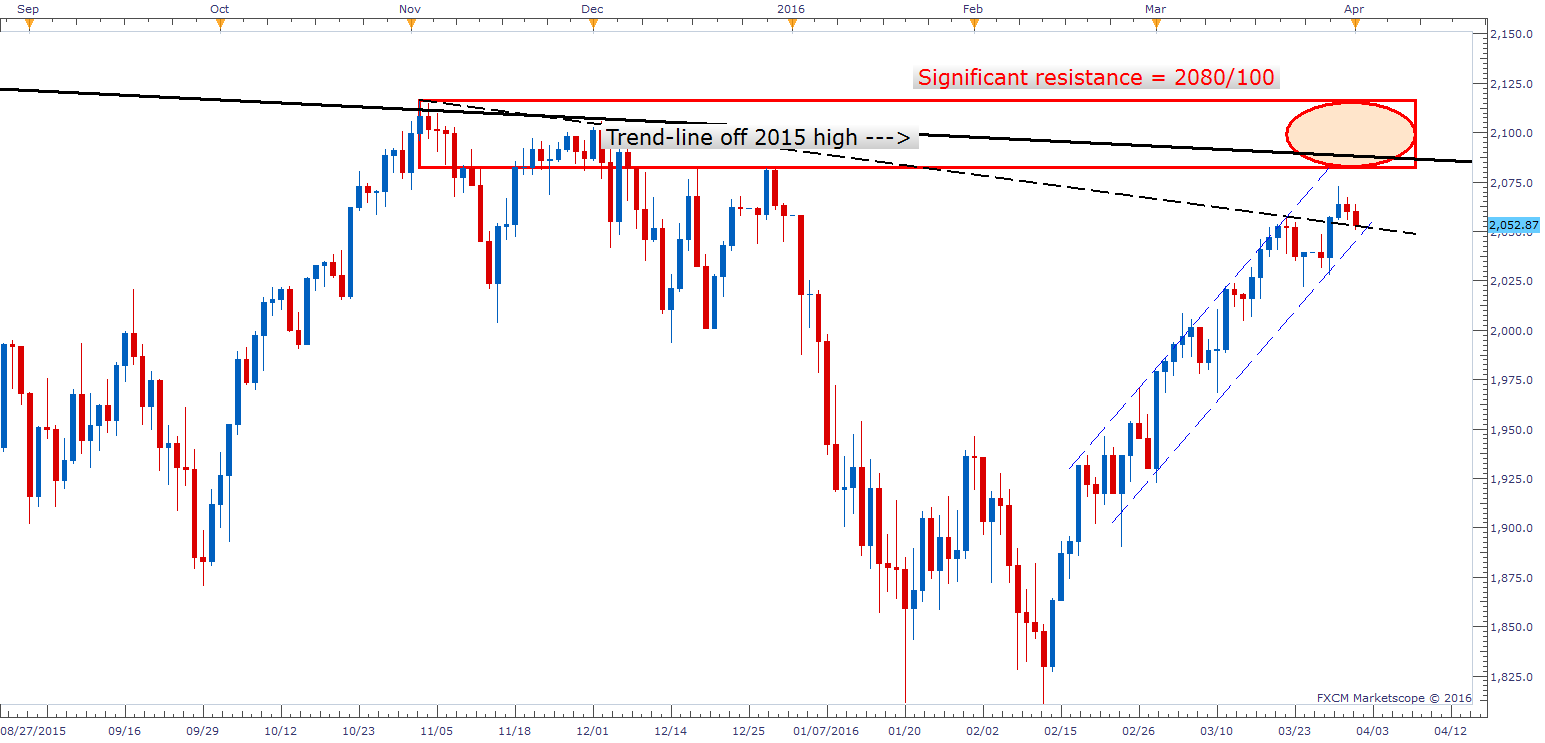
Looking at the market from a broader standpoint the story remains the same. The market continues to exhibit strength in the face of looming resistance between 2080 and 2100 for the S&P 500, while the Dow is already flirting with major overhead supply between 17775 and 18000. The Nasdaq 100 is challenging the barrier surrounding 4500.
It’s a tough spot with the market persistently bid as walls of resistance are on the bow. As said yesterday: it’s hard to buy, but it’s hard to sell, too. The S&P holds the key on this end as it is the most focused index of the 'big three'. If the benchmark can get into the 2080/100 zone we could finally see the game change.
At this juncture, given the exhaustive run from the February low, thick resistance looks more likely than not to be too much for the market to overcome without at least a material decline taking hold first. With that said, if it is to get there - the sooner the better so we can take action. Until then, it could be more of the same; pop higher, grind, pop higher. It’s more of a day-traders market at this point, if you ask me. The channel ('bull-flag') developing on the hourly could provide a guide moving beyond today, perhaps leading us right into the desired 2080/100 zone. It is also starting to take shape at t-line support on daily chart as well. More on this as market action unfolds.
Daily: Aug '15 - Present
No ‘NFP guesses’ on this end. Will perhaps look for a day-trade by fading any overreaction the market might experience. However, these NFP ‘fade-trades’ tend to work best in the FX market where reactions to major data events generally offer cleaner looks.
Help make yourself a better trader, check out this guide.
---Written by Paul Robinson, Market Analyst
You can follow Paul on Twitter @PaulRobinsonFX, or email him directly at instructor@dailyfx.com.


