


Highlights:
- S&P 500 pullback helped alleviate overbought conditions
- Trend off February low remains intact with two references in focus
- 1890 holds important significance
Market digesting overbought conditions
Yesterday, we discussed one indicator showing breadth to be overbought in the short-term, and what it could mean as we move forward. What we are watching is how the market reacts in the face of these market conditions. If we are to see higher prices in the weeks ahead, then overbought conditions shouldn't be met with overly aggressive selling; a change in market character from the past couple of months. However, should sellers step show up en masse, then we will need to adjust this notion.
Trend off Feb low intact, reference points in focus
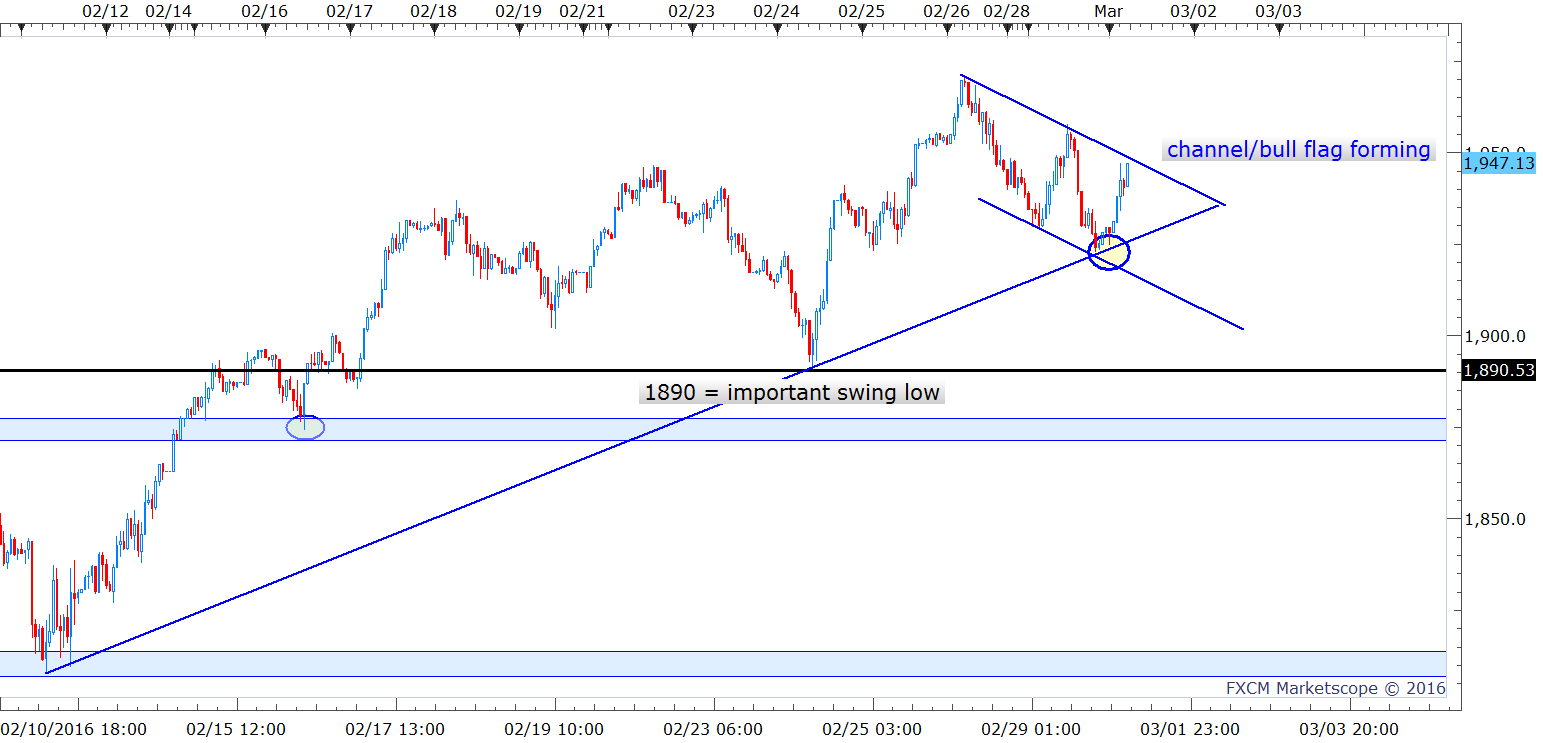
The trend off the February low remains solidly intact as long as the S&P can maintain above the trend-line extending back below the 2/24 swing low to the 2/11 bottom. If it undercuts trend-line support it doesn't necessarily mean the picture turns outright bearish, but it will raise a caution flag to the bulls' case while providing some short-term ammo for the bears. In this event, a move towards the 2/24 low at 1890 becomes increasingly probable.
1890 is important
1890 is effectively the line-in-the-sand from we sit before the current leg higher becomes undermined in a material fashion. Ideally, if the market is to trade higher, then the S&P 500 will cleanly carve out another higher low at or above t-line support, or at least without making a serious assault on 1890.
Development which could offer entry soon
The move lower off the Friday high could offer up a channel/bull-flag worth sinking our teeth into upon further development. Thus far this possibility is working its way towards reality as we could find the S&P wedged up between the top-side parallel off the 2/26 high and rising t-line off the 2/11 low.
Dips to trend support and a breakout above the upper parallel offer points of entry from the long-side. A break below trend support will give cause for pause.
A break higher brings 1971 (2/26 high) into focus, with a larger move taking the market towards the all-important area surrounding 2000.
S&P 500 Hourly: February
Find out what separates successful traders from the rest.
---Written by Paul Robinson, Market Analyst
You can follow Paul on Twitter at @PaulRobinsonFX, or email him directly at instructor@dailyfx.com with any questions, comments, or concerns.


