


Highlights:
- S&P 500 short-term overbought
- Breadth at an extreme, but market not responding negatively
- Above 1890 bias is higher when looking out over several weeks
US stock markets are overbought in the short-term. The major question at hand is how will the S&P 500 continue to respond to strongly overbought conditions? It's in the price action subsequent to a powerful move in which we can learn much information.
Market breadth is at an extreme
Short-term momentum in market breadth is presently levitating at a level which in the past has corresponded with either a strong move lower developing in fairly quick order, or if no immediate weakness developed then the market continued to push higher in the weeks to follow.
Change in character under way
Market breadth became short-term overbought a week ago, but major indices have yet to move swiftly lower outside of the intra-day time-frame (last Wednesday, sell-off and rebound --- which in of itself was a positive development not seen in a while).
If stocks can continue to hold up in the face of overbought conditions versus turning sharply lower as they had the past two times we saw similar conditions, then this will surely be a change in market character.
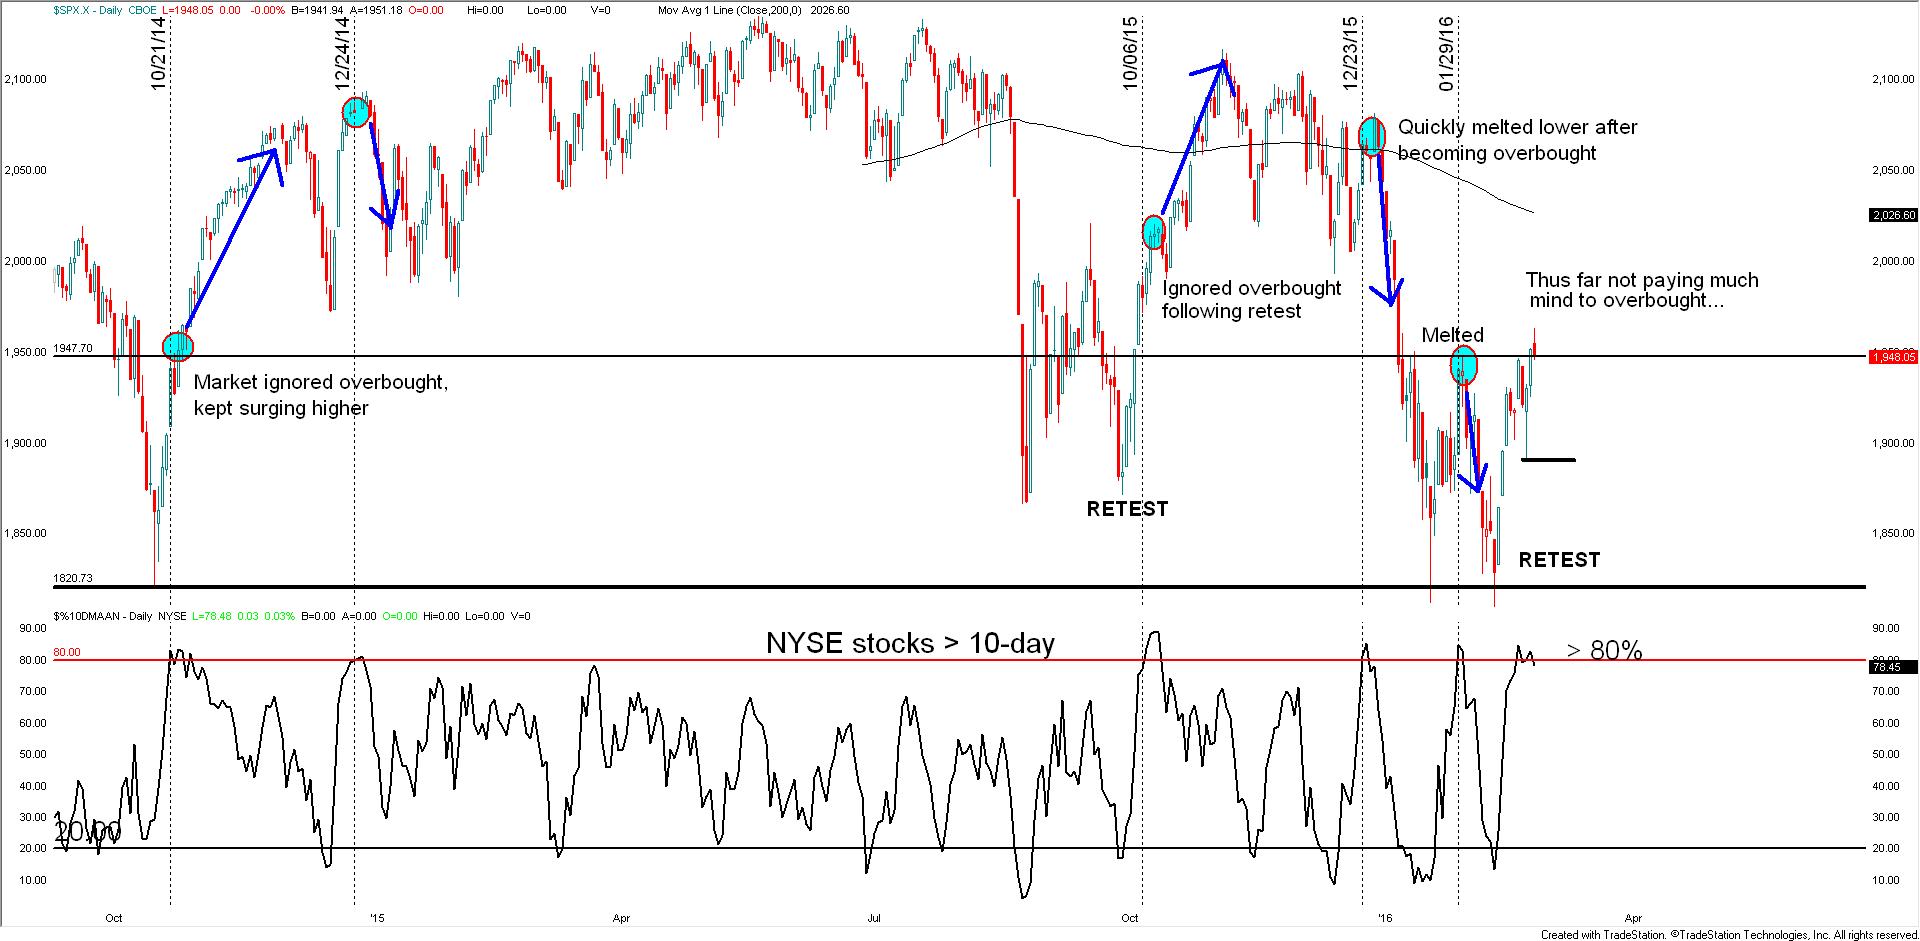
Simple measurement of market breadth
There are many ways to measure market breadth or its health (most of which are highly correlated to one another), but one simple way is to measure the number of stocks in an index or exchange which are trading above or below a specific moving average. While not a big fan of moving averages for chart analysis, they can be useful as a yardstick for measurement on a relative basis. The number of stocks on the New York Stock Exchange (NYSE) trading above the 10-day moving average is maintaining around 80%, which is considered to be quite extreme.
S&P 500 w/NYSE % > 10-day MA
The thinking in this corner
It looks more likely at this time given the pessimism surrounding stocks and the hold of the 1800 level in the S&P 500 earlier in the month, instead of the market melting lower from a state of overbought it will act more akin to how it did during October of last year and the October/November period in 2014. Both instances saw extreme short-term overbought breadth readings shortly into a rebound off the lows, but it meant little when looking out over the next several weeks. A hold above 1890 (last Wednesday's reversal day) in the SPX will be pivotal for this outlook at this time.
Need help executing trade ideas? Check out this piece for more on what traits successful traders commonly have.
---Written by Paul Robinson, Market Analyst
To contact Paul you can email him directly at instructor@dailyfx.com. He can also be found on Twitter at @PaulRobinsonFX.


