To receive Tyler’s analysis directly via email, please SIGN UP HERE
Talking Points:
- Crude Oil Technical Strategy: Setting Up For Breakout
- Ichimoku Cloud Holding Down WTI / Crude Oil Price
- Unlikely Form of Bullishness Has Risen
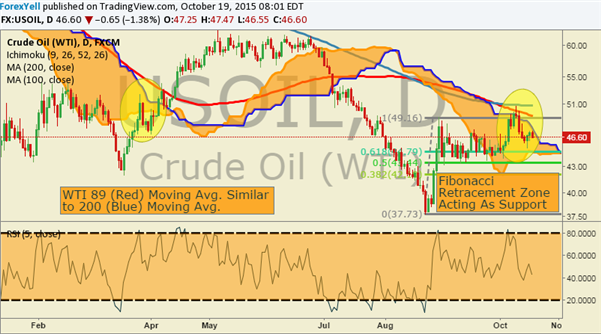
WTI Crude Oil price has recently respected resistance as shown via the 200-day moving average as well as the Ichimoku cloud. However, a rare form of support and potential bullishness has come into the picture. The support comes in the form of a 2-month low in the Chicago Board Options Exchange Crude Oil Volatility Index. The last time we saw a similar move was a few days before a 30+ % move, and therefore, we could soon see a move higher. The nature of the Oil volatility index is that less volatility is expected in the future, but that is often interpreted as a bullish sign as fear, and lower prices go hand-in-hand with volatility.
The Daily crude oil price chart is looking similar to late March of this year. At that time, price move aggressively higher from a new low only to retrace roughly a third of the move before eventually breaking out higher, completing a 50% balance to the upside. In addition to the similarity of price action to prior breakout, crude oil price has held Fibonacci support around $44.80 per barrel of the August 24 – August 31 range. The longer we hold above this range, with declining volatility expectations, the more likely we will see oil price crawl higher from these nearly decade low prices.
While the environment is setting up for potential upside, we need to remain aware of resistance on the chart. Crude oil daily price bars are currently trading below two major moving averages, the 200 and 89 simple moving average, as well as the Ichimoku cloud. It is premature to get excited about immediate upside as we remain below these price ceilings. However, a break above those resistance points in conjunction with a drop in expected volatility could add to the pent-up bullishness being expressed in higher prices. T.Y.
Add these technical levels directly to your charts with our Support/Resistance Wizard app