


Talking Points:
- US Dollar Fails to Range Bounds Despite Large Weekend Gap
- S&P 500 Accelerates Lower, Posts Largest Drop in 14 Months
- Crude Oil Breaks Five-Month Trend, Gold in Familiar Range
Can’t access the Dow Jones FXCM US Dollar Index? Try the USD basket on Mirror Trader. **
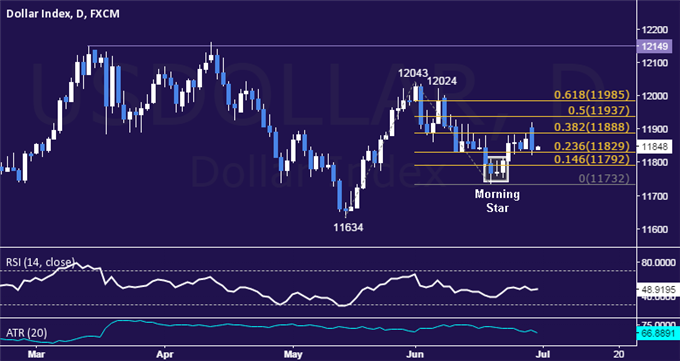
US DOLLAR TECHNICAL ANALYSIS – Prices advanced as expected after prices put in a bullish Morning Star candlestick pattern. Near-term resistance is at 11888, the 38.2% Fibonacci expansion, with a break above that on a daily closing basis exposing the 50% level at 11937. Alternatively, a move below the 23.6% Fib at 11829 opens the door for a challenge of the 14.6% level at 11792.
** The Dow Jones FXCM US Dollar Index and the Mirror Trader USD basket are not the same product.
S&P 500 TECHNICAL ANALYSIS – Prices accelerated downward after reversing lower as expected. From here, a break below the 123.6% Fibonacci expansion at 2047.40exposes the 2037.70-2040.10 area (March 11 low, 138.2% level). Alternatively, a reversal above the 100% Fib at 2063.10 targets the 76.4% expansion at 2078.80.

GOLD TECHNICAL ANALYSIS – Prices continue to consolidate above two-month support after failing to hold up above the $1200/oz figure. A break below the 1170.30-86 area (May 1 low, 50% Fibonacci expansion) exposes the 61.8% level at 1162.64. Alternatively, a move above the 38.2% Fib at 1179.07 targets the 23.6% expansion at 1189.24.

CRUDE OIL TECHNICAL ANALYSIS – Prices broke support at a rising trend line capping losses since mid-January, hinting the longer-term down trend may be resuming. A break below the 60.27-61.37 area (38.2% Fibonacci retracement, April 22 low) exposes the 50% level at 57.39. Alternatively, a move back above the trend line – now at 63.56 – targets the 23.6% Fib expansion at 66.69.

--- Written by Ilya Spivak, Currency Strategist for DailyFX.com
To receive Ilya's analysis directly via email, please SIGN UP HERE
Contact and follow Ilya on Twitter: @IlyaSpivak


