


Talking Points:
- US Dollar Technical Positioning Hints at Recovery Ahead
- S&P 500 Bounces After Pullback, Sets New Monthly High
- Crude Oil Aiming Lower, Gold Erases Post-FOMC Rally
Can’t access the Dow Jones FXCM US Dollar Index? Try the USD basket on Mirror Trader. **
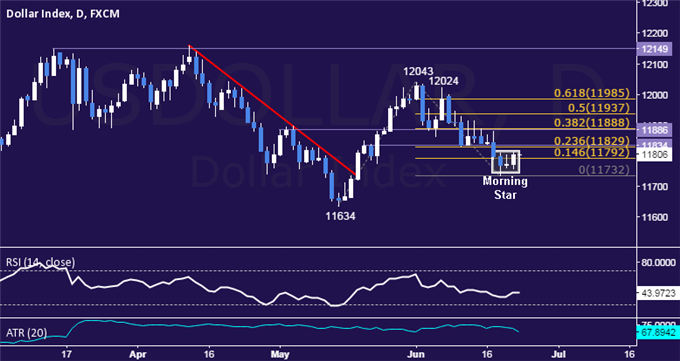
US DOLLAR TECHNICAL ANALYSIS – Prices may be preparing to turn higher after prices put in a bullish Morning Star candlestick pattern. Near-term resistance is in the 11823-34 area (23.6% Fibonacci expansion, horizontal pivot), with a break above that on a daily closing basis exposing the 38.2% level at 11888. Alternatively, a turn below the 14.6% Fib at 11792 opens the door for a challenge of the June 18 low at 11732.
** The Dow Jones FXCM US Dollar Index and the Mirror Trader USD basket are not the same product.
S&P 500 TECHNICAL ANALYSIS – Prices are in digestion mode after breaking down trend resistance set from mid-May last week. A break above the 2127.60-37.10 area (May 19, June 18 highs) exposes channel top resistance at 2154.30. Alternatively, a move back below trend line resistance-turned-support at 2100.09 targets the channel floor at 2085.00.

GOLD TECHNICAL ANALYSIS – Prices turned sharply lower, erasing last week’s post-FOMC advance. From here, a break below the 38.2% Fibonacci expansion at 1179.07 exposes the 50% level at 1170.86. Alternatively, a move above the 23.6% Fib at 1189.24 targets the 14.6% expansion at 1195.51.

CRUDE OIL TECHNICAL ANALYSIS – Prices broke support guiding the recovery from mid-January, suggesting the longer-term down trend is resuming. From here, a break below the 38.2% Fibonacci retracement at 60.27 exposes the 50% level at 57.39. Alternatively, a move back above the trend line support-turned-resistance at 63.88 eyes the 23.6% Fib expansion at 66.69.

--- Written by Ilya Spivak, Currency Strategist for DailyFX.com
To receive Ilya's analysis directly via email, please SIGN UP HERE
Contact and follow Ilya on Twitter: @IlyaSpivak


