


Talking Points:
- US Dollar Marking Time After Pushing Through Range Floor
- S&P 500 in Digestion Mode After Last Week’s Upside Break
- Gold Stalls Above $1200/oz, Crude Oil Breaks Trend Support
Can’t access the Dow Jones FXCM US Dollar Index? Try the USD basket on Mirror Trader. **
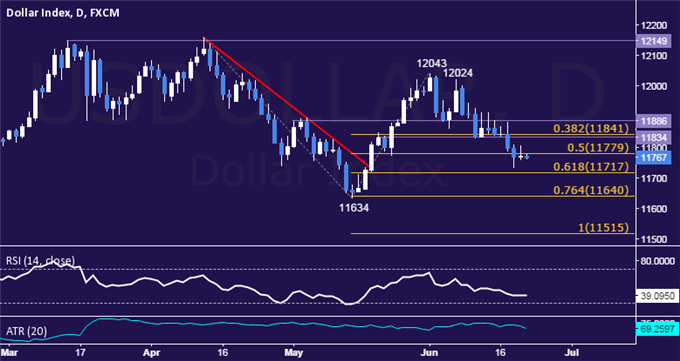
US DOLLAR TECHNICAL ANALYSIS – Prices paused to consolidate after breaking range support following last week’s FOMC-inspired losses. Near-term support is at 11717, the 61.8% Fibonacci expansion, with a break below that on a daily closing basis exposing the 11634-40 zone (May 14 low, 76.4% level). Alternatively, a move above the 50% Fib at 11779 opens the door for a challenge of the 11834-41 area (horizontal pivot, 38.2% expansion).
** The Dow Jones FXCM US Dollar Index and the Mirror Trader USD basket are not the same product.
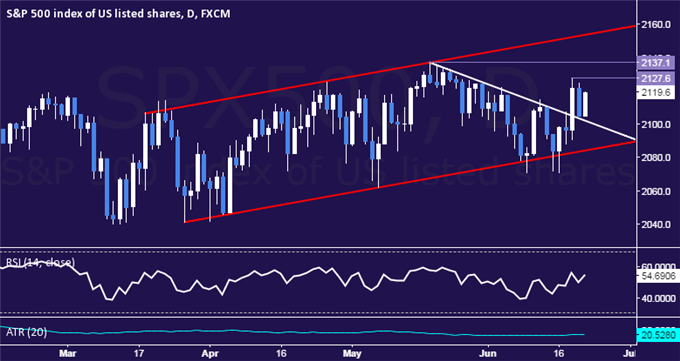
S&P 500 TECHNICAL ANALYSIS – Prices are in digestion mode after breaking down trend resistance set from mid-May last week. A break above the 2127.60-37.10 area (May 19, June 18 highs) exposes channel top resistance at 2153.80. Alternatively, a move back below trend line resistance-turned-support at 2101.90 targets the channel floor at 2084.00.
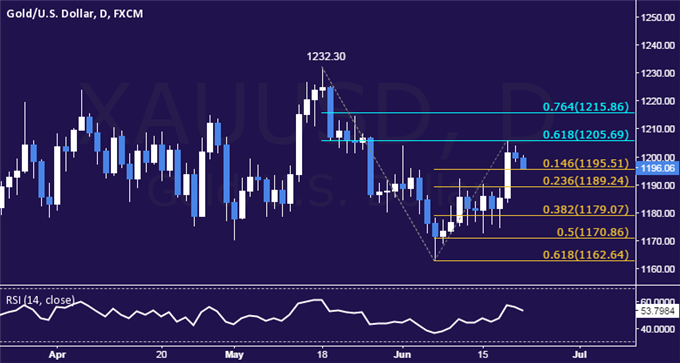
GOLD TECHNICAL ANALYSIS – Prices stalled after hitting a one-month high. A break below the 14.6% Fibonacci expansion at 1195.51 exposes the 23.6% level at 1189.24. Alternatively, a move above the 61.8% Fib retracement at 1205.69 targets the 76.4% threshold at 1215.86.
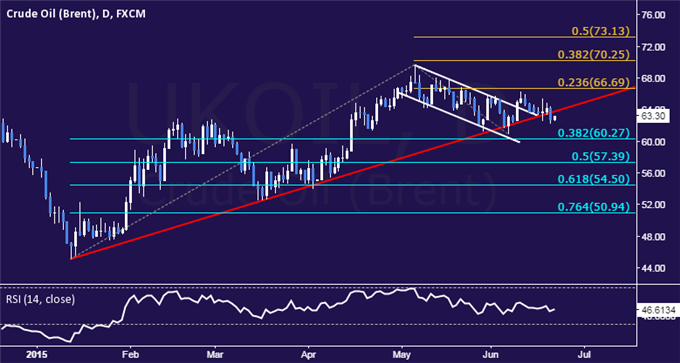
CRUDE OIL TECHNICAL ANALYSIS – Prices broke support guiding the recovery from mid-January, suggesting the longer-term down trend is resuming. From here, a break below the 38.2% Fibonacci retracement at 60.27 exposes the 50% level at 57.39. Alternatively, a move back above the trend line support-turned-resistance at 63.76 eyes the 23.6% Fib expansion at 66.69.
--- Written by Ilya Spivak, Currency Strategist for DailyFX.com
To receive Ilya's analysis directly via email, please SIGN UP HERE
Contact and follow Ilya on Twitter: @IlyaSpivak


