


Talking Points:
- US Dollar Continues to Oscillate in Familiar Trading Band
- S&P 500 Threatening to Overturn 3-Month Up Move Again
- Gold Drifts to Range Top, Crude Oil Stuck at Trend Support
Can’t access the Dow Jones FXCM US Dollar Index? Try the USD basket on Mirror Trader. **
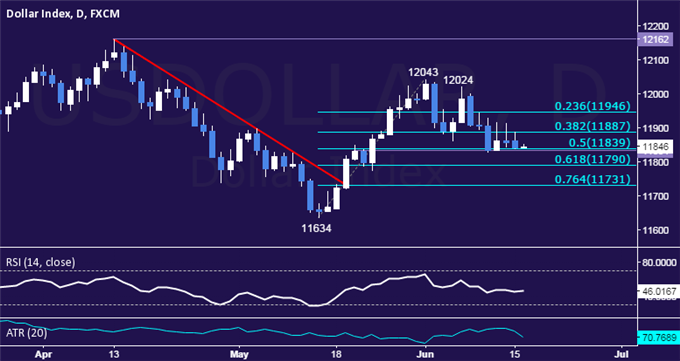
US DOLLAR TECHNICAL ANALYSIS – Prices paused to digest losses after sliding to the weakest level in three weeks. Near-term support is at 11834-9 area (May 20 close, 50% Fibonacci retracement), with a break below that on a daily closing basis exposing the 61.8% level at 11790. Alternatively, a move above the 38.2% Fib at 11887 opens the door for a challenge of the 23.6% retracement at 11946.
** The Dow Jones FXCM US Dollar Index and the Mirror Trader USD basket are not the same product.
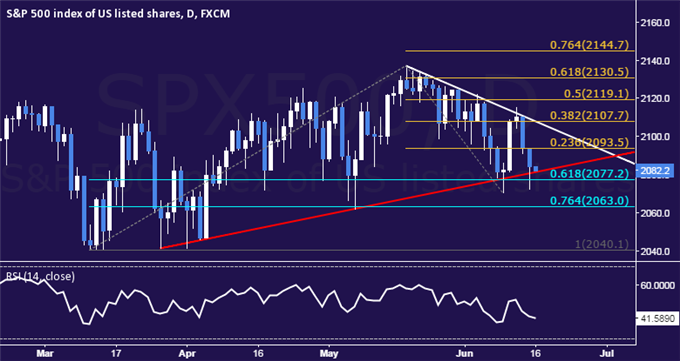
S&P 500 TECHNICAL ANALYSIS – Prices pulled back to test rising trend line support set from late-March lows once again, a barrier reinforced by the 61.8% Fibonacci retracement at 2077.20. A break below that targets the 76.4% level at 2063.00. Alternatively, a turn above the 23.6% Fib expansion at 2093.50 targets the 38.2% threshold at 2107.70.
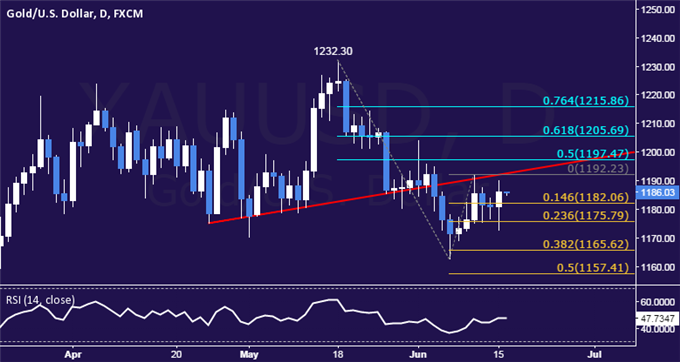
GOLD TECHNICAL ANALYSIS – Prices continue to tread water below the $1200/oz figure. A break above the June 10 high at 1192.23 exposes the 50% Fibonacci retracement at 1197.47. Alternatively, a move below the 14.6% Fib expansion at 1182.06 targets the 23.6% threshold at 1175.79.
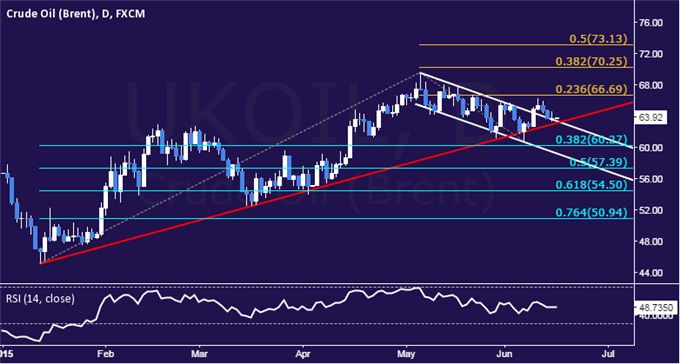
CRUDE OIL TECHNICAL ANALYSIS – Prices may be resuming the recovery launched from mid-January lows after completing a Flag continuation pattern. Near-term resistance is at 66.69, the 23.6% Fibonacci expansion, with a break above that exposing the 38.2% level at 70.25. Alternatively, a move below the 63.08-39 area (Flag top resistance-turned-support at, rising trend line) targets the 38.2% Fib retracement at 60.27.
--- Written by Ilya Spivak, Currency Strategist for DailyFX.com
To receive Ilya's analysis directly via email, please SIGN UP HERE
Contact and follow Ilya on Twitter: @IlyaSpivak


