


Talking Points:
- US Dollar Extends Rebound, Hits Strongest Level in a Month
- S&P 500 Still Treading Water After Setting New Record High
- Gold, Crude Oil Continue to Oscillate in Congestion Ranges
Can’t access the Dow Jones FXCM US Dollar Index? Try the USD basket on Mirror Trader. **
US DOLLAR TECHNICAL ANALYSIS – Prices are attempting to extend upside momentum after touching the highest level in a month. A daily close above the 50% Fibonacci retracementat 11898 exposes the 61.8% level at 11960. Alternatively, a reversal below the 38.2% Fib at 11836 opens the door for a challenge of the 23.6% retracement at 11759.
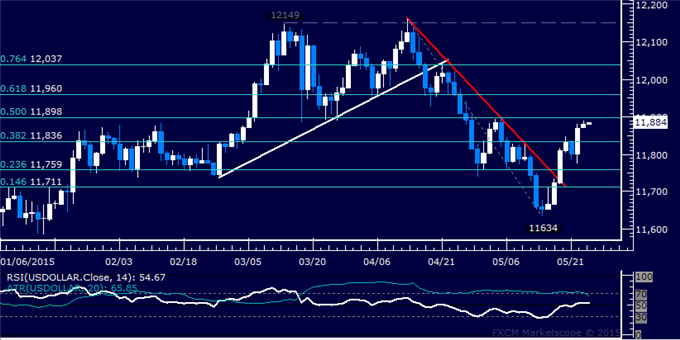
Daily Chart - Created Using FXCM Marketscope
** The Dow Jones FXCM US Dollar Index and the Mirror Trader USD basket are not the same product.
S&P 500 TECHNICAL ANALYSIS – Prices are consolidating after breaking range resistance and setting a new record high. From here, a daily close above the 50% Fibonacci expansion at 2140.70 exposes the 61.8% level at 2159.30. Alternatively, a move back below the 38.2% Fib at 2122.10 targets the 23.6% expansion at 2099.10.
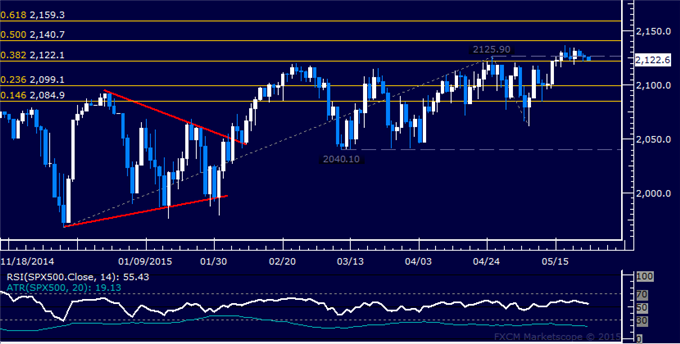
Daily Chart - Created Using FXCM Marketscope
GOLD TECHNICAL ANALYSIS – Prices continue to consolidate after recoiling from resistance below $1250/oz. A close below trend line resistance-turned-support at 1203.88 exposes the 23.6% Fibonacci expansion at 1193.38. Near-term resistance is at 1232.30, the May 18 high.
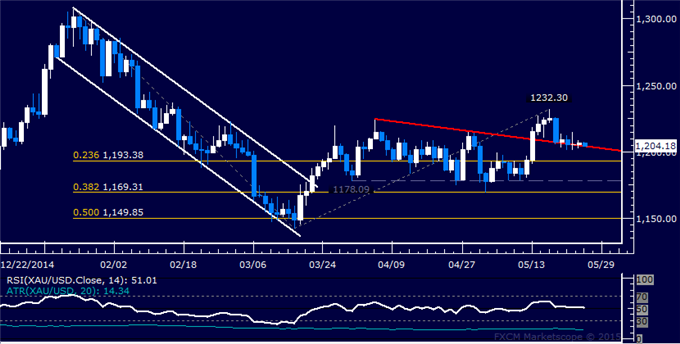
Daily Chart - Created Using FXCM Marketscope
CRUDE OIL TECHNICAL ANALYSIS – Prices remain locked in a choppy consolidation range below the $70/barrel figure. A daily close below the 23.6% Fibonacci retracement exposes the 38.2% level at 60.27. Alternatively, a move above trend line resistance at 66.57 targets the 23.6% Fib expansion at 69.70.
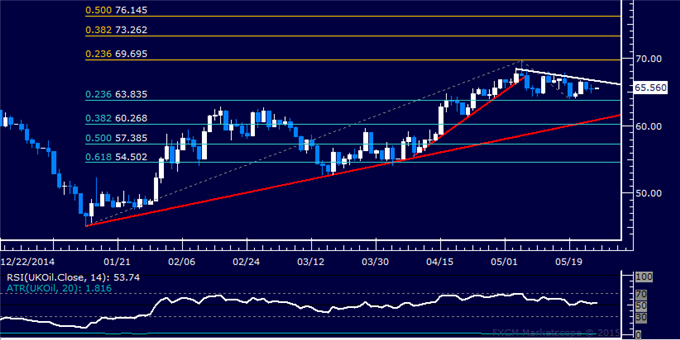
Daily Chart - Created Using FXCM Marketscope
--- Written by Ilya Spivak, Currency Strategist for DailyFX.com
To receive Ilya's analysis directly via email, please SIGN UP HERE
Contact and follow Ilya on Twitter: @IlyaSpivak


